PRM Stock Tickeron detected bullish Stock Pattern: Wedge Rising on November 21, 2025


at Tickeron.com


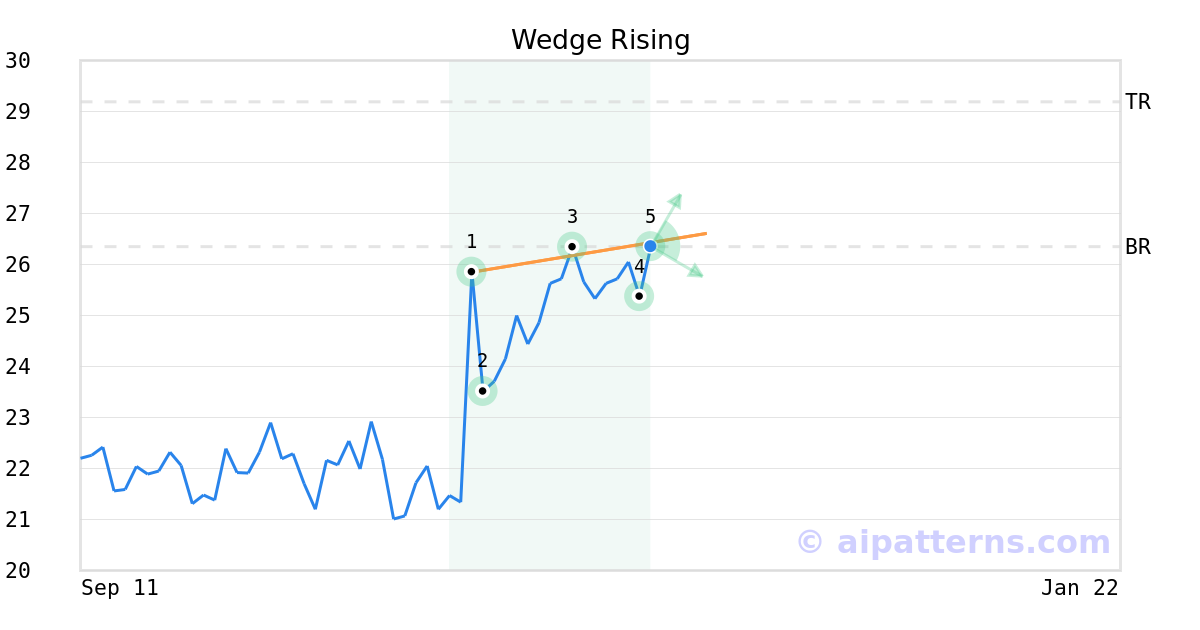
A.I.dvisor detected a bullish Wedge Rising pattern for PRM stock. This pattern was detected on November 21, 2025 . The odds of reaching the target price are 6.
The Rising Wedge pattern forms when prices seem to be spiraling upward, and two upward sloping trend lines are created with the price hitting higher highs (1, 3, 5) and higher lows (2,4).
Consider buying a security or call option at the breakout price level. When trading, wait for the confirmation move, which is when the price rises above the breakout level.
Aroon Indicator for PRM shows an upward move is likely
PRM's Aroon Indicator triggered a bullish signal on December 01, 2025. Tickeron's A.I.dvisor detected that the AroonUp green line is above 70 while the AroonDown red line is below 30. When the up indicator moves above 70 and the down indicator remains below 30, it is a sign that the stock could be setting up for a bullish move. Traders may want to buy the stock or look to buy calls options. A.I.dvisor looked at 199 similar instances where the Aroon Indicator showed a similar pattern. In of the 199 cases, the stock moved higher in the days that followed. This puts the odds of a move higher at .

Technical Analysis (Indicators)
Bullish Trend Analysis
The Momentum Indicator moved above the 0 level on November 14, 2025. You may want to consider a long position or call options on PRM as a result. In of 66 past instances where the momentum indicator moved above 0, the stock continued to climb. The odds of a continued upward trend are .
The Moving Average Convergence Divergence (MACD) for PRM just turned positive on October 30, 2025. Looking at past instances where PRM's MACD turned positive, the stock continued to rise in of 33 cases over the following month. The odds of a continued upward trend are .
PRM moved above its 50-day moving average on October 30, 2025 date and that indicates a change from a downward trend to an upward trend.
The 10-day moving average for PRM crossed bullishly above the 50-day moving average on October 30, 2025. This indicates that the trend has shifted higher and could be considered a buy signal. In of 12 past instances when the 10-day crossed above the 50-day, the stock continued to move higher over the following month. The odds of a continued upward trend are .
Following a 3-day Advance, the price is estimated to grow further. Considering data from situations where PRM advanced for three days, in of 234 cases, the price rose further within the following month. The odds of a continued upward trend are .
Bearish Trend Analysis
The 10-day RSI Indicator for PRM moved out of overbought territory on December 01, 2025. This could be a bearish sign for the stock. Traders may want to consider selling the stock or buying put options. Tickeron's A.I.dvisor looked at 32 similar instances where the indicator moved out of overbought territory. In of the 32 cases, the stock moved lower in the following days. This puts the odds of a move lower at .
The Stochastic Oscillator demonstrated that the ticker has stayed in the overbought zone for 3 days. The longer the ticker stays in the overbought zone, the sooner a price pull-back is expected.
Following a 3-day decline, the stock is projected to fall further. Considering past instances where PRM declined for three days, the price rose further in of 62 cases within the following month. The odds of a continued downward trend are .
PRM broke above its upper Bollinger Band on November 25, 2025. This could be a sign that the stock is set to drop as the stock moves back below the upper band and toward the middle band. You may want to consider selling the stock or exploring put options.
Fundamental Analysis (Ratings)
The Tickeron PE Growth Rating for this company is (best 1 - 100 worst), pointing to outstanding earnings growth. The PE Growth rating is based on a comparative analysis of stock PE ratio increase over the last 12 months compared against S&P 500 index constituents.
The Tickeron Price Growth Rating for this company is (best 1 - 100 worst), indicating steady price growth. PRM’s price grows at a higher rate over the last 12 months as compared to S&P 500 index constituents.
The Tickeron SMR rating for this company is (best 1 - 100 worst), indicating slightly better than average sales and a considerably profitable business model. SMR (Sales, Margin, Return on Equity) rating is based on comparative analysis of weighted Sales, Income Margin and Return on Equity values compared against S&P 500 index constituents. The weighted SMR value is a proprietary formula developed by Tickeron and represents an overall profitability measure for a stock.
The Tickeron Valuation Rating of (best 1 - 100 worst) indicates that the company is slightly overvalued in the industry. This rating compares market capitalization estimated by our proprietary formula with the current market capitalization. This rating is based on the following metrics, as compared to industry averages: P/B Ratio (3.658) is normal, around the industry mean (4.607). P/E Ratio (50.889) is within average values for comparable stocks, (78.397). Projected Growth (PEG Ratio) (0.000) is also within normal values, averaging (2.557). PRM has a moderately low Dividend Yield (0.000) as compared to the industry average of (0.031). P/S Ratio (6.378) is also within normal values, averaging (109.650).
The Tickeron Profit vs. Risk Rating rating for this company is (best 1 - 100 worst), indicating that the returns do not compensate for the risks. PRM’s unstable profits reported over time resulted in significant Drawdowns within these last five years. A stable profit reduces stock drawdown and volatility. The average Profit vs. Risk Rating rating for the industry is 87, placing this stock worse than average.
Advertisement
General Information
Industry ChemicalsSpecialty