PSCJ Stock Tickeron detected bullish ETF Pattern: Broadening Top on January 15, 2025


at Tickeron.com


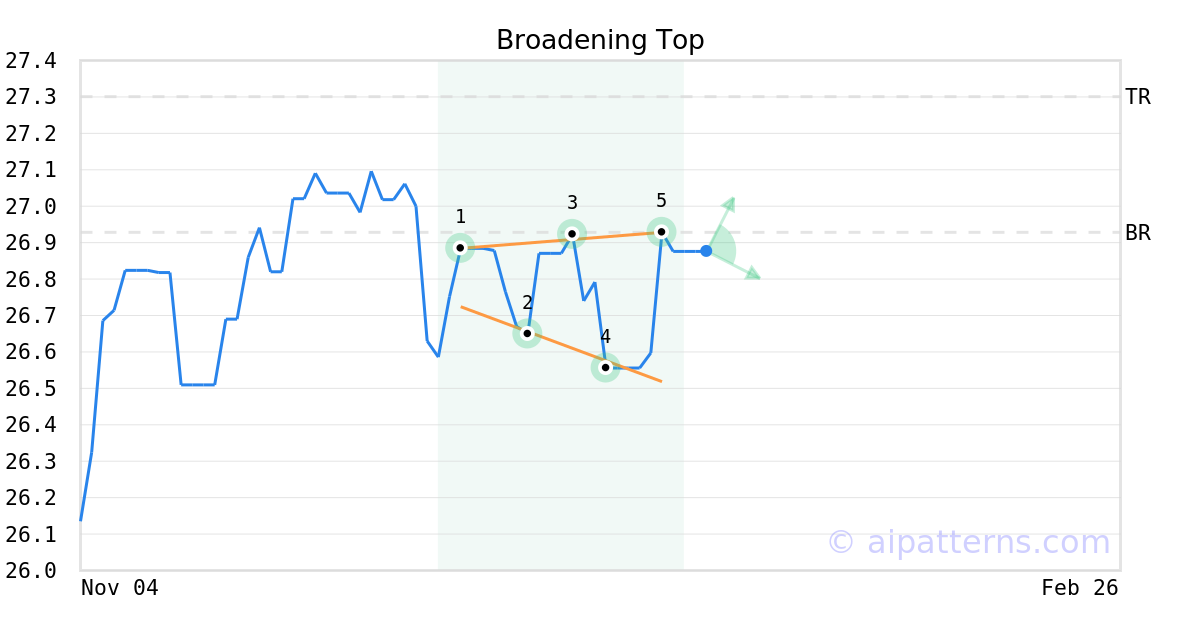
A.I.dvisor detected a bullish Broadening Top pattern for PSCJ stock. This pattern was detected on January 15, 2025 . The odds of reaching the target price are 6.
The Broadening Top pattern forms when the price of a security progressively makes higher highs (1, 3) and lower lows (2, 4) following two widening trend lines.
Consider buying a security or call option at the upward breakout price/entry point.
PSCJ in upward trend: price rose above 50-day moving average on November 26, 2025
PSCJ moved above its 50-day moving average on November 26, 2025 date and that indicates a change from a downward trend to an upward trend. In of 38 similar past instances, the stock price increased further within the following month. The odds of a continued upward trend are .

Technical Analysis (Indicators)
Bullish Trend Analysis
The Stochastic Oscillator suggests the stock price trend may be in a reversal from a downward trend to an upward trend. of 42 cases where PSCJ's Stochastic Oscillator exited the oversold zone resulted in an increase in price. Tickeron's analysis proposes that the odds of a continued upward trend are .
The Momentum Indicator moved above the 0 level on November 26, 2025. You may want to consider a long position or call options on PSCJ as a result. In of 57 past instances where the momentum indicator moved above 0, the stock continued to climb. The odds of a continued upward trend are .
PSCJ may jump back above the lower band and head toward the middle band. Traders may consider buying the stock or exploring call options.
The Aroon Indicator entered an Uptrend today. In of 396 cases where PSCJ Aroon's Indicator entered an Uptrend, the price rose further within the following month. The odds of a continued Uptrend are .
Bearish Trend Analysis
The 10-day RSI Indicator for PSCJ moved out of overbought territory on November 05, 2025. This could be a bearish sign for the stock. Traders may want to consider selling the stock or buying put options. Tickeron's A.I.dvisor looked at 49 similar instances where the indicator moved out of overbought territory. In of the 49 cases, the stock moved lower in the following days. This puts the odds of a move lower at .
The Moving Average Convergence Divergence Histogram (MACD) for PSCJ turned negative on November 14, 2025. This could be a sign that the stock is set to turn lower in the coming weeks. Traders may want to sell the stock or buy put options. Tickeron's A.I.dvisor looked at 40 similar instances when the indicator turned negative. In of the 40 cases the stock turned lower in the days that followed. This puts the odds of success at .
Advertisement
General Information
Category Unknown