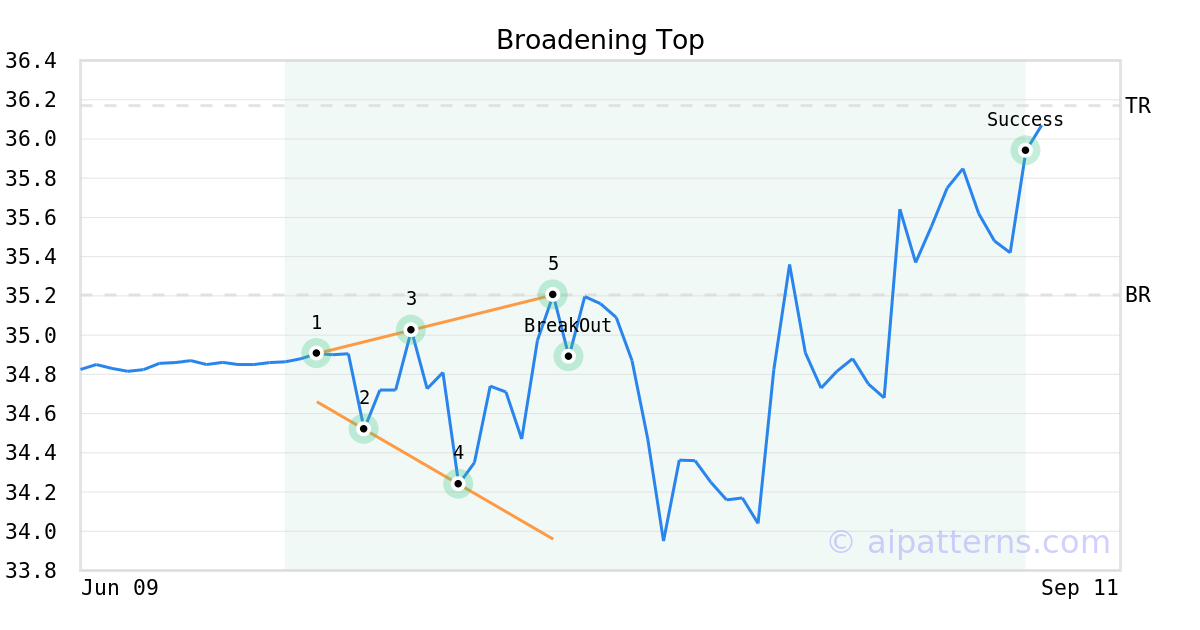
PTMC Stock Tickeron detected bullish ETF Pattern: Broadening Top PTMC on July 24, 2025, netting in a 2.09% gain over 1 month


at Tickeron.com


PTMC in upward trend: price may ascend as a result of having broken its lower Bollinger Band on September 25, 2025
PTMC may jump back above the lower band and head toward the middle band. Traders may consider buying the stock or exploring call options. In of 38 cases where PTMC's price broke its lower Bollinger Band, its price rose further in the following month. The odds of a continued upward trend are .

Technical Analysis (Indicators)
Bullish Trend Analysis
The Stochastic Oscillator suggests the stock price trend may be in a reversal from a downward trend to an upward trend. of 55 cases where PTMC's Stochastic Oscillator exited the oversold zone resulted in an increase in price. Tickeron's analysis proposes that the odds of a continued upward trend are .
The Momentum Indicator moved above the 0 level on October 03, 2025. You may want to consider a long position or call options on PTMC as a result. In of 102 past instances where the momentum indicator moved above 0, the stock continued to climb. The odds of a continued upward trend are .
Following a 3-day Advance, the price is estimated to grow further. Considering data from situations where PTMC advanced for three days, in of 300 cases, the price rose further within the following month. The odds of a continued upward trend are .
The Aroon Indicator entered an Uptrend today. In of 209 cases where PTMC Aroon's Indicator entered an Uptrend, the price rose further within the following month. The odds of a continued Uptrend are .
Bearish Trend Analysis
The Moving Average Convergence Divergence Histogram (MACD) for PTMC turned negative on September 16, 2025. This could be a sign that the stock is set to turn lower in the coming weeks. Traders may want to sell the stock or buy put options. Tickeron's A.I.dvisor looked at 51 similar instances when the indicator turned negative. In of the 51 cases the stock turned lower in the days that followed. This puts the odds of success at .
Following a 3-day decline, the stock is projected to fall further. Considering past instances where PTMC declined for three days, the price rose further in of 62 cases within the following month. The odds of a continued downward trend are .


Advertisement
General Information
Category MidCapBlend