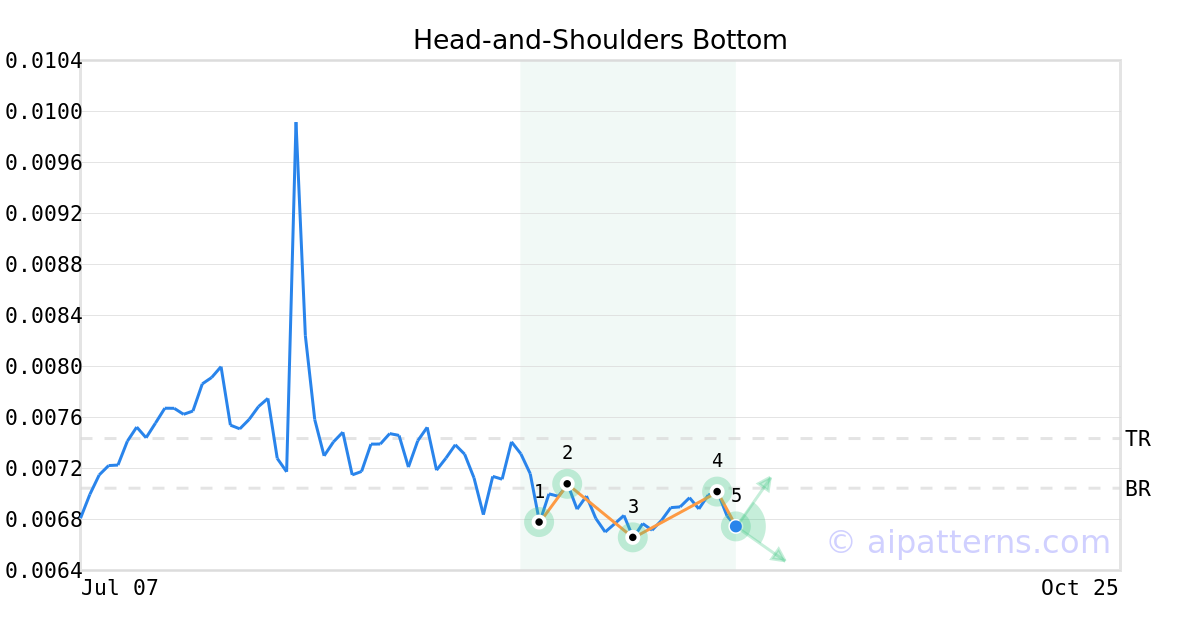
QKC.X Crypto Tickeron detected bullish Crypto Pattern: Head-and-Shoulders Bottom on September 15, 2025


at Tickeron.com


QKC.X in +1.12% Uptrend, growing for three consecutive days on September 10, 2025
Moving higher for three straight days is viewed as a bullish sign. Keep an eye on this stock for future growth. Considering data from situations where QKC.X advanced for three days, in of 220 cases, the price rose further within the following month. The odds of a continued upward trend are .

Technical Analysis (Indicators)
Bullish Trend Analysis
The Moving Average Convergence Divergence (MACD) for QKC.X just turned positive on September 08, 2025. Looking at past instances where QKC.X's MACD turned positive, the stock continued to rise in of 30 cases over the following month. The odds of a continued upward trend are .
Bearish Trend Analysis
The Stochastic Oscillator may be shifting from an upward trend to a downward trend. In of 37 cases where QKC.X's Stochastic Oscillator exited the overbought zone, the price fell further within the following month. The odds of a continued downward trend are .
The Momentum Indicator moved below the 0 level on September 15, 2025. You may want to consider selling the stock, shorting the stock, or exploring put options on QKC.X as a result. In of 64 cases where the Momentum Indicator fell below 0, the stock fell further within the subsequent month. The odds of a continued downward trend are .
QKC.X moved below its 50-day moving average on August 17, 2025 date and that indicates a change from an upward trend to a downward trend.
The 10-day moving average for QKC.X crossed bearishly below the 50-day moving average on August 17, 2025. This indicates that the trend has shifted lower and could be considered a sell signal. In of 9 past instances when the 10-day crossed below the 50-day, the stock continued to move higher over the following month. The odds of a continued downward trend are .
The 50-day moving average for QKC.X moved below the 200-day moving average on September 14, 2025. This could be a long-term bearish signal for the stock as the stock shifts to an downward trend.
Following a 3-day decline, the stock is projected to fall further. Considering past instances where QKC.X declined for three days, the price rose further in of 62 cases within the following month. The odds of a continued downward trend are .
QKC.X broke above its upper Bollinger Band on September 11, 2025. This could be a sign that the stock is set to drop as the stock moves back below the upper band and toward the middle band. You may want to consider selling the stock or exploring put options.
The Aroon Indicator for QKC.X entered a downward trend on September 08, 2025. This could indicate a strong downward move is ahead for the stock. Traders may want to consider selling the stock or buying put options.


Advertisement