RAAX Stock Tickeron detected bearish ETF Pattern: Head-and-Shoulders Top on November 24, 2025


at Tickeron.com


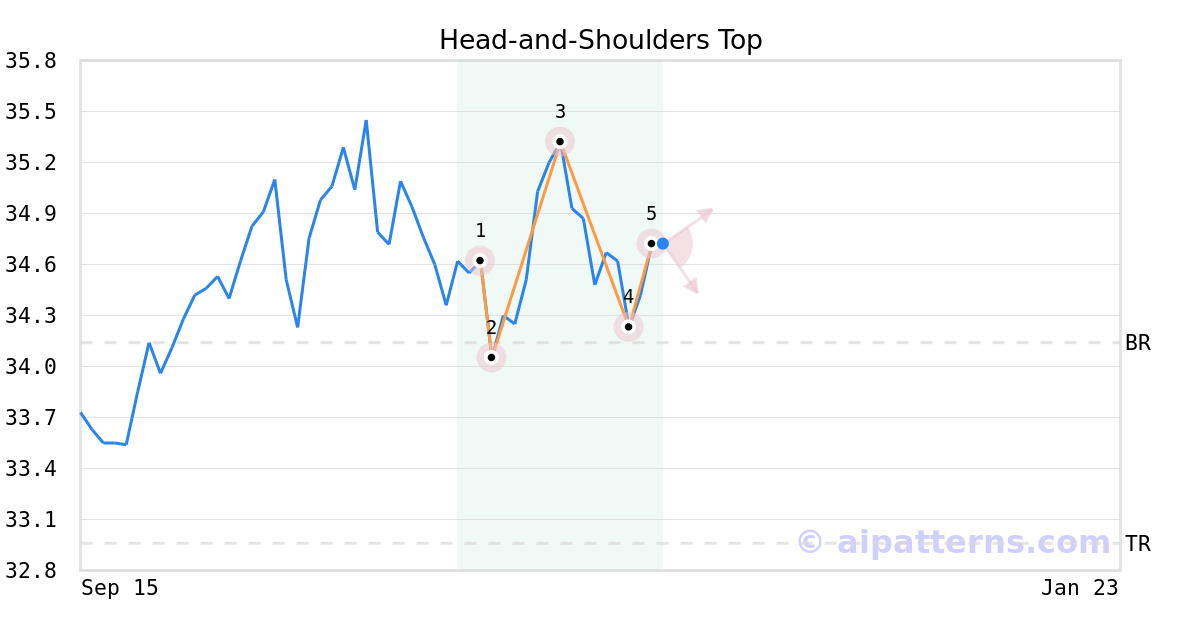
A.I.dvisor detected a bearish Head-and-Shoulders Top pattern for RAAX stock. This pattern was detected on November 24, 2025 . The odds of reaching the target price are .
The pattern forms with a center peak (the Head, labeled 3) and left and right Shoulders (1, 5). Eventually the security stops testing highs and reverses trend into a decline.
Consider selling a security short before it declines or buying a put option to benefit from the price decline. To improve success chances, wait for a confirmation move: allow the price to break below the Neckline level (2, 4), which is calculated as the average of the two lows between the Head and the Shoulders.
Momentum Indicator for RAAX turns negative, indicating new downward trend
RAAX saw its Momentum Indicator move below the 0 level on November 20, 2025. This is an indication that the stock could be shifting in to a new downward move. Traders may want to consider selling the stock or exploring put options. Tickeron's A.I.dvisor looked at 81 similar instances where the indicator turned negative. In of the 81 cases, the stock moved further down in the following days. The odds of a decline are at .

Technical Analysis (Indicators)
Bearish Trend Analysis
The Moving Average Convergence Divergence Histogram (MACD) for RAAX turned negative on November 17, 2025. This could be a sign that the stock is set to turn lower in the coming weeks. Traders may want to sell the stock or buy put options. Tickeron's A.I.dvisor looked at 44 similar instances when the indicator turned negative. In of the 44 cases the stock turned lower in the days that followed. This puts the odds of success at .
Following a 3-day decline, the stock is projected to fall further. Considering past instances where RAAX declined for three days, the price rose further in of 62 cases within the following month. The odds of a continued downward trend are .
The Aroon Indicator for RAAX entered a downward trend on November 14, 2025. This could indicate a strong downward move is ahead for the stock. Traders may want to consider selling the stock or buying put options.
Bullish Trend Analysis
The Stochastic Oscillator demonstrated that the ticker has stayed in the oversold zone for 2 days, which means it's wise to expect a price bounce in the near future.
RAAX moved above its 50-day moving average on November 24, 2025 date and that indicates a change from a downward trend to an upward trend.
Following a 3-day Advance, the price is estimated to grow further. Considering data from situations where RAAX advanced for three days, in of 363 cases, the price rose further within the following month. The odds of a continued upward trend are .
RAAX may jump back above the lower band and head toward the middle band. Traders may consider buying the stock or exploring call options.
Advertisement
General Information
Category ModerateAllocation