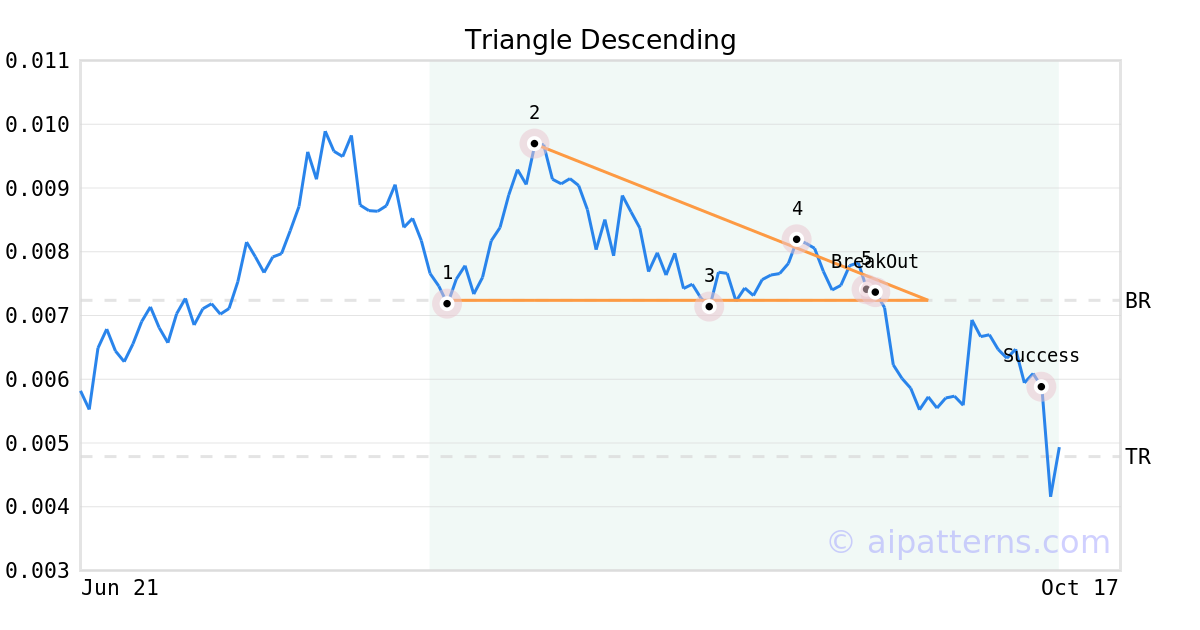
RSR.X Crypto Tickeron detected bearish Crypto Pattern: Triangle Descending RSR.X on September 20, 2025, netting in a 20.47% gain over 2 weeks


at Tickeron.com


RSR.X in -2.37% downward trend, declining for three consecutive days on October 19, 2025
Moving lower for three straight days is viewed as a bearish sign. Keep an eye on this stock for future declines. Considering data from situations where RSR.X declined for three days, in of 413 cases, the price declined further within the following month. The odds of a continued downward trend are .

Technical Analysis (Indicators)
Bearish Trend Analysis
The Stochastic Oscillator demonstrated that the ticker has stayed in the overbought zone for 5 days. The longer the ticker stays in the overbought zone, the sooner a price pull-back is expected.
The 50-day moving average for RSR.X moved below the 200-day moving average on September 29, 2025. This could be a long-term bearish signal for the stock as the stock shifts to an downward trend.
The Aroon Indicator for RSR.X entered a downward trend on October 17, 2025. This could indicate a strong downward move is ahead for the stock. Traders may want to consider selling the stock or buying put options.
Bullish Trend Analysis
The RSI Oscillator points to a transition from a downward trend to an upward trend -- in cases where RSR.X's RSI Indicator exited the oversold zone, of 38 resulted in an increase in price. Tickeron's analysis proposes that the odds of a continued upward trend are .
The Momentum Indicator moved above the 0 level on October 17, 2025. You may want to consider a long position or call options on RSR.X as a result. In of 128 past instances where the momentum indicator moved above 0, the stock continued to climb. The odds of a continued upward trend are .
The Moving Average Convergence Divergence (MACD) for RSR.X just turned positive on October 14, 2025. Looking at past instances where RSR.X's MACD turned positive, the stock continued to rise in of 65 cases over the following month. The odds of a continued upward trend are .
Following a +3 3-day Advance, the price is estimated to grow further. Considering data from situations where RSR.X advanced for three days, in of 415 cases, the price rose further within the following month. The odds of a continued upward trend are .
RSR.X may jump back above the lower band and head toward the middle band. Traders may consider buying the stock or exploring call options.


Advertisement