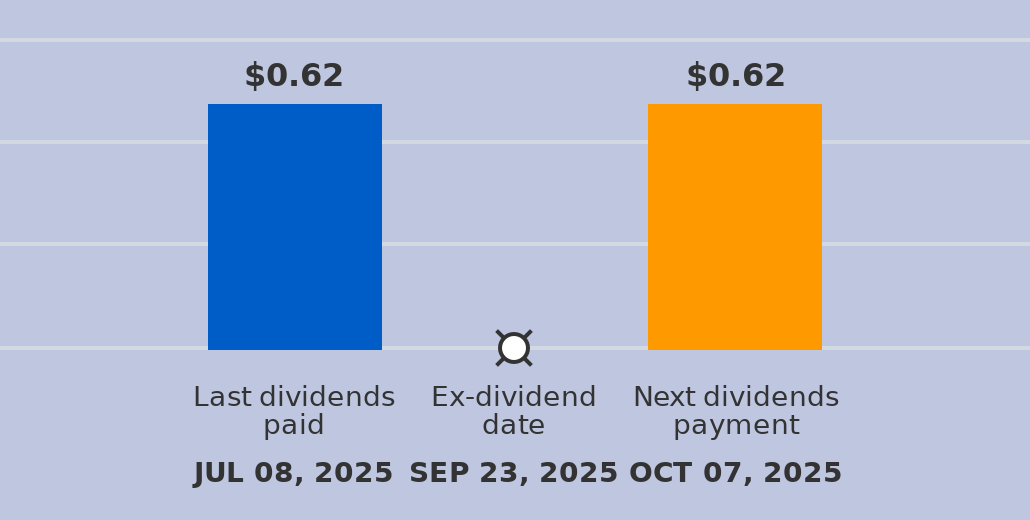
RSTRF Stock Restaurant Brands International Limited Partnership (RSTRF) is expected to pay dividends on October 07, 2025


at Tickeron.com
RSTRF's RSI Oscillator climbs out of oversold territory
The RSI Oscillator for RSTRF moved out of oversold territory on September 23, 2025. This could be a sign that the stock is shifting from a downward trend to an upward trend. Traders may want to buy the stock or call options. The A.I.dvisor looked at 20 similar instances when the indicator left oversold territory. In of the 20 cases the stock moved higher. This puts the odds of a move higher at .

Technical Analysis (Indicators)
Bullish Trend Analysis
The Moving Average Convergence Divergence (MACD) for RSTRF just turned positive on September 08, 2025. Looking at past instances where RSTRF's MACD turned positive, the stock continued to rise in of 32 cases over the following month. The odds of a continued upward trend are .
Bearish Trend Analysis
The Stochastic Oscillator demonstrated that the ticker has stayed in the overbought zone for 7 days. The longer the ticker stays in the overbought zone, the sooner a price pull-back is expected.
The Momentum Indicator moved below the 0 level on September 22, 2025. You may want to consider selling the stock, shorting the stock, or exploring put options on RSTRF as a result. In of 40 cases where the Momentum Indicator fell below 0, the stock fell further within the subsequent month. The odds of a continued downward trend are .
RSTRF broke above its upper Bollinger Band on September 23, 2025. This could be a sign that the stock is set to drop as the stock moves back below the upper band and toward the middle band. You may want to consider selling the stock or exploring put options.
The Aroon Indicator for RSTRF entered a downward trend on September 22, 2025. This could indicate a strong downward move is ahead for the stock. Traders may want to consider selling the stock or buying put options.
Fundamental Analysis (Ratings)
The Tickeron PE Growth Rating for this company is (best 1 - 100 worst), pointing to outstanding earnings growth. The PE Growth rating is based on a comparative analysis of stock PE ratio increase over the last 12 months compared against S&P 500 index constituents.
The Tickeron SMR rating for this company is (best 1 - 100 worst), indicating strong sales and a profitable business model. SMR (Sales, Margin, Return on Equity) rating is based on comparative analysis of weighted Sales, Income Margin and Return on Equity values compared against S&P 500 index constituents. The weighted SMR value is a proprietary formula developed by Tickeron and represents an overall profitability measure for a stock.
The Tickeron Profit vs. Risk Rating rating for this company is (best 1 - 100 worst), indicating well-balanced risk and returns. The average Profit vs. Risk Rating rating for the industry is 82, placing this stock slightly better than average.
The Tickeron Price Growth Rating for this company is (best 1 - 100 worst), indicating steady price growth. RSTRF’s price grows at a higher rate over the last 12 months as compared to S&P 500 index constituents.
The Tickeron Valuation Rating of (best 1 - 100 worst) indicates that the company is significantly overvalued in the industry. This rating compares market capitalization estimated by our proprietary formula with the current market capitalization. This rating is based on the following metrics, as compared to industry averages: P/B Ratio (4.325) is normal, around the industry mean (6.392). P/E Ratio (24.556) is within average values for comparable stocks, (37.003). RSTRF's Projected Growth (PEG Ratio) (0.000) is very low in comparison to the industry average of (1.552). Dividend Yield (0.037) settles around the average of (0.048) among similar stocks. P/S Ratio (2.412) is also within normal values, averaging (8.469).


Advertisement
General Information
Industry Restaurants