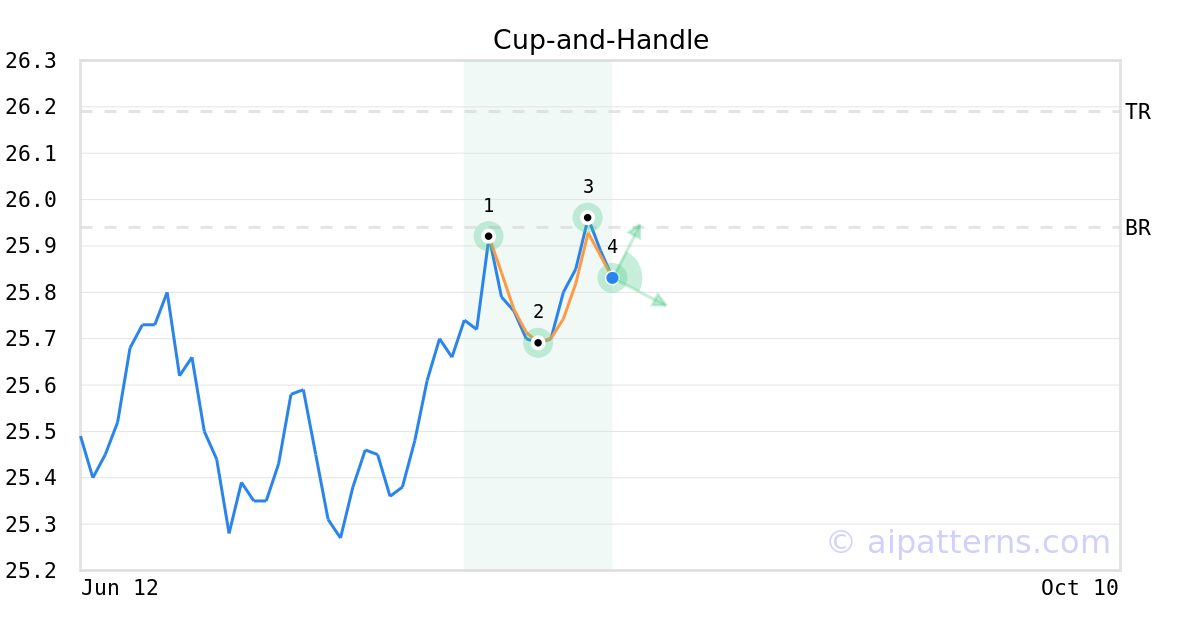
RZC Stock Tickeron detected bullish ETF Pattern: Cup-and-Handle on August 14, 2025


at Tickeron.com


RZC sees its Stochastic Oscillator ascending out of oversold territory
On September 04, 2025, the Stochastic Oscillator for RZC moved out of oversold territory and this could be a bullish sign for the stock. Traders may want to buy the stock or buy call options. Tickeron's A.I.dvisor looked at 44 instances where the indicator left the oversold zone. In of the 44 cases the stock moved higher in the following days. This puts the odds of a move higher at over .

Technical Analysis (Indicators)
Bullish Trend Analysis
The Momentum Indicator moved above the 0 level on September 05, 2025. You may want to consider a long position or call options on RZC as a result. In of 60 past instances where the momentum indicator moved above 0, the stock continued to climb. The odds of a continued upward trend are .
RZC moved above its 50-day moving average on September 02, 2025 date and that indicates a change from a downward trend to an upward trend.
Following a 3-day Advance, the price is estimated to grow further. Considering data from situations where RZC advanced for three days, in of 181 cases, the price rose further within the following month. The odds of a continued upward trend are .
The Aroon Indicator entered an Uptrend today. In of 47 cases where RZC Aroon's Indicator entered an Uptrend, the price rose further within the following month. The odds of a continued Uptrend are .
Bearish Trend Analysis
The Moving Average Convergence Divergence Histogram (MACD) for RZC turned negative on August 21, 2025. This could be a sign that the stock is set to turn lower in the coming weeks. Traders may want to sell the stock or buy put options. Tickeron's A.I.dvisor looked at 30 similar instances when the indicator turned negative. In of the 30 cases the stock turned lower in the days that followed. This puts the odds of success at .
Following a 3-day decline, the stock is projected to fall further. Considering past instances where RZC declined for three days, the price rose further in of 62 cases within the following month. The odds of a continued downward trend are .
RZC broke above its upper Bollinger Band on August 18, 2025. This could be a sign that the stock is set to drop as the stock moves back below the upper band and toward the middle band. You may want to consider selling the stock or exploring put options.


Advertisement