SAA Stock Tickeron detected bullish ETF Pattern: Broadening Wedge Descending SAA on November 24, 2025, netting in a 11.17% gain over 6 days


at Tickeron.com


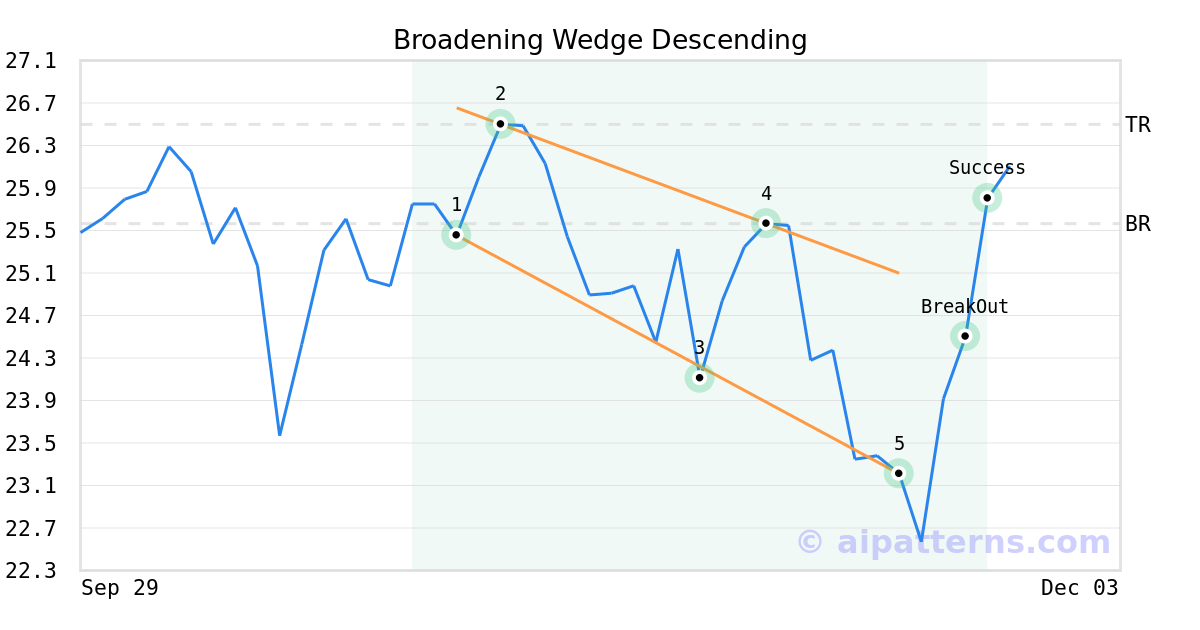
On November 19, 2025, A.I.dvisor detected a Broadening Wedge Descending Pattern (Bullish) for ProShares Ultra SmallCap600 (SAA, $23.21). On November 24, 2025, A.I.dvisor confirmed the Bullish pattern, setting a target price of $26.50. 1 day later, on November 25, 2025, SAA reached the target price resulting in a +1 for traders who took a long position in the stock.
SAA's RSI Indicator recovers from oversold territory
The RSI Oscillator for SAA moved out of oversold territory on November 21, 2025. This could be a sign that the stock is shifting from a downward trend to an upward trend. Traders may want to buy the stock or call options. The A.I.dvisor looked at 30 similar instances when the indicator left oversold territory. In of the 30 cases the stock moved higher. This puts the odds of a move higher at .

Technical Analysis (Indicators)
Bullish Trend Analysis
The Momentum Indicator moved above the 0 level on November 25, 2025. You may want to consider a long position or call options on SAA as a result. In of 95 past instances where the momentum indicator moved above 0, the stock continued to climb. The odds of a continued upward trend are .
The Moving Average Convergence Divergence (MACD) for SAA just turned positive on November 25, 2025. Looking at past instances where SAA's MACD turned positive, the stock continued to rise in of 45 cases over the following month. The odds of a continued upward trend are .
SAA moved above its 50-day moving average on November 25, 2025 date and that indicates a change from a downward trend to an upward trend.
Following a 3-day Advance, the price is estimated to grow further. Considering data from situations where SAA advanced for three days, in of 310 cases, the price rose further within the following month. The odds of a continued upward trend are .
SAA may jump back above the lower band and head toward the middle band. Traders may consider buying the stock or exploring call options.
Bearish Trend Analysis
The Stochastic Oscillator demonstrated that the ticker has stayed in the overbought zone for 3 days. The longer the ticker stays in the overbought zone, the sooner a price pull-back is expected.
The 10-day moving average for SAA crossed bearishly below the 50-day moving average on November 06, 2025. This indicates that the trend has shifted lower and could be considered a sell signal. In of 17 past instances when the 10-day crossed below the 50-day, the stock continued to move higher over the following month. The odds of a continued downward trend are .
Following a 3-day decline, the stock is projected to fall further. Considering past instances where SAA declined for three days, the price rose further in of 62 cases within the following month. The odds of a continued downward trend are .
The Aroon Indicator for SAA entered a downward trend on December 02, 2025. This could indicate a strong downward move is ahead for the stock. Traders may want to consider selling the stock or buying put options.
Advertisement
General Information
Category Trading