SMR Stock Tickeron detected bearish Stock Pattern: Cup-and-Handle Inverse SMR on October 21, 2025, netting in a 34.30% gain over 1 month


at Tickeron.com


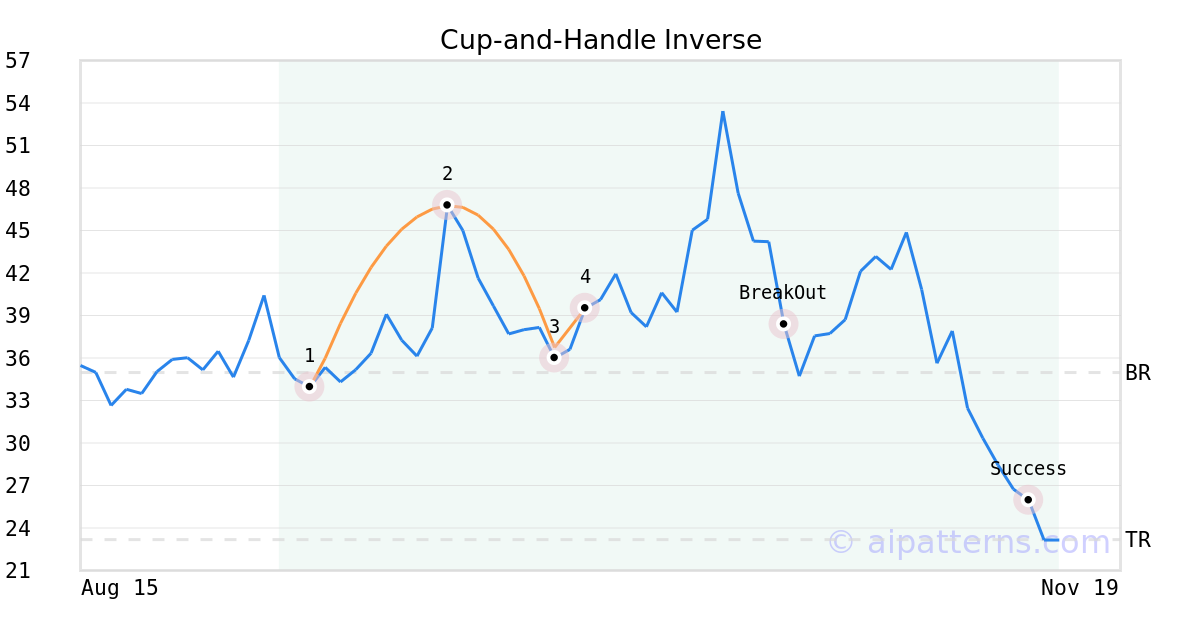
On October 02, 2025, A.I.dvisor detected a Cup-and-Handle Inverse Pattern (Bearish) for NuScale Power Corp (SMR, $39.51). 19 days later, on October 21, 2025, A.I.dvisor confirmed the Bearish pattern, setting a target price of the stock. On November 12, 2025, the stock hit the target price of $23.18 – resulting in a +3 gain for traders who shorted the stock on the pattern detection date.
SMR in -9.03% downward trend, sliding for three consecutive days on November 17, 2025
Moving lower for three straight days is viewed as a bearish sign. Keep an eye on this stock for future declines. Considering data from situations where SMR declined for three days, in of 269 cases, the price declined further within the following month. The odds of a continued downward trend are .

Technical Analysis (Indicators)
Bearish Trend Analysis
The Momentum Indicator moved below the 0 level on November 06, 2025. You may want to consider selling the stock, shorting the stock, or exploring put options on SMR as a result. In of 96 cases where the Momentum Indicator fell below 0, the stock fell further within the subsequent month. The odds of a continued downward trend are .
The Moving Average Convergence Divergence Histogram (MACD) for SMR turned negative on November 03, 2025. This could be a sign that the stock is set to turn lower in the coming weeks. Traders may want to sell the stock or buy put options. Tickeron's A.I.dvisor looked at 41 similar instances when the indicator turned negative. In of the 41 cases the stock turned lower in the days that followed. This puts the odds of success at .
SMR moved below its 50-day moving average on November 04, 2025 date and that indicates a change from an upward trend to a downward trend.
The 10-day moving average for SMR crossed bearishly below the 50-day moving average on November 07, 2025. This indicates that the trend has shifted lower and could be considered a sell signal. In of 15 past instances when the 10-day crossed below the 50-day, the stock continued to move higher over the following month. The odds of a continued downward trend are .
The Aroon Indicator for SMR entered a downward trend on November 18, 2025. This could indicate a strong downward move is ahead for the stock. Traders may want to consider selling the stock or buying put options.
Bullish Trend Analysis
The RSI Indicator shows that the ticker has stayed in the oversold zone for 5 days. The price of this ticker is presumed to bounce back soon, since the longer the ticker stays in the oversold zone, the more promptly an Uptrend is expected.
The Stochastic Oscillator shows that the ticker has stayed in the oversold zone for 8 days. The price of this ticker is presumed to bounce back soon, since the longer the ticker stays in the oversold zone, the more promptly an upward trend is expected.
Following a +1 3-day Advance, the price is estimated to grow further. Considering data from situations where SMR advanced for three days, in of 241 cases, the price rose further within the following month. The odds of a continued upward trend are .
SMR may jump back above the lower band and head toward the middle band. Traders may consider buying the stock or exploring call options.
Fundamental Analysis (Ratings)
The Tickeron Valuation Rating of (best 1 - 100 worst) indicates that the company is fair valued in the industry. This rating compares market capitalization estimated by our proprietary formula with the current market capitalization. This rating is based on the following metrics, as compared to industry averages: P/B Ratio (4.357) is normal, around the industry mean (4.956). P/E Ratio (0.000) is within average values for comparable stocks, (65.792). SMR's Projected Growth (PEG Ratio) (0.000) is slightly lower than the industry average of (2.251). SMR has a moderately low Dividend Yield (0.000) as compared to the industry average of (0.023). P/S Ratio (65.789) is also within normal values, averaging (61.034).
The Tickeron Price Growth Rating for this company is (best 1 - 100 worst), indicating slightly worse than average price growth. SMR’s price grows at a lower rate over the last 12 months as compared to S&P 500 index constituents.
The Tickeron SMR rating for this company is (best 1 - 100 worst), indicating weak sales and an unprofitable business model. SMR (Sales, Margin, Return on Equity) rating is based on comparative analysis of weighted Sales, Income Margin and Return on Equity values compared against S&P 500 index constituents. The weighted SMR value is a proprietary formula developed by Tickeron and represents an overall profitability measure for a stock.
The Tickeron PE Growth Rating for this company is (best 1 - 100 worst), pointing to worse than average earnings growth. The PE Growth rating is based on a comparative analysis of stock PE ratio increase over the last 12 months compared against S&P 500 index constituents.
The Tickeron Profit vs. Risk Rating rating for this company is (best 1 - 100 worst), indicating that the returns do not compensate for the risks. SMR’s unstable profits reported over time resulted in significant Drawdowns within these last five years. A stable profit reduces stock drawdown and volatility. The average Profit vs. Risk Rating rating for the industry is 72, placing this stock worse than average.
Advertisement
General Information
Industry IndustrialMachinery