SPE Stock Tickeron detected bullish ETF Pattern: Wedge Falling SPE on November 10, 2025, netting in a 1.68% gain over 1 week


at Tickeron.com


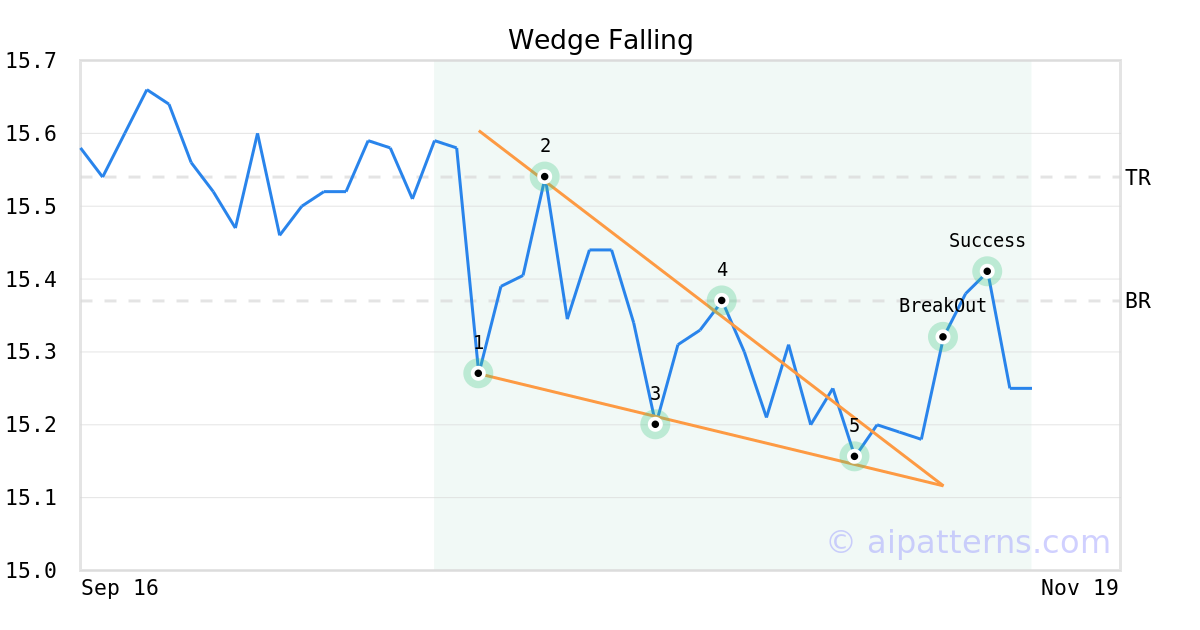
On November 04, 2025, A.I.dvisor detected a Wedge Falling Pattern (Bullish) for Special Opportunities Fund (SPE, $15.16). On November 10, 2025, A.I.dvisor confirmed the Bullish pattern, setting a target price of $15.54. 2 days later, on November 12, 2025, SPE reached the target price resulting in a for traders who took a long position in the stock.
SPE sees its Stochastic Oscillator recovers from oversold territory
On November 11, 2025, the Stochastic Oscillator for SPE moved out of oversold territory and this could be a bullish sign for the stock. Traders may want to buy the stock or buy call options. Tickeron's A.I.dvisor looked at 46 instances where the indicator left the oversold zone. In of the 46 cases the stock moved higher in the following days. This puts the odds of a move higher at over .

Technical Analysis (Indicators)
Bullish Trend Analysis
The Momentum Indicator moved above the 0 level on November 14, 2025. You may want to consider a long position or call options on SPE as a result. In of 77 past instances where the momentum indicator moved above 0, the stock continued to climb. The odds of a continued upward trend are .
The Moving Average Convergence Divergence (MACD) for SPE just turned positive on November 10, 2025. Looking at past instances where SPE's MACD turned positive, the stock continued to rise in of 45 cases over the following month. The odds of a continued upward trend are .
Following a 3-day Advance, the price is estimated to grow further. Considering data from situations where SPE advanced for three days, in of 323 cases, the price rose further within the following month. The odds of a continued upward trend are .
Bearish Trend Analysis
SPE moved below its 50-day moving average on November 13, 2025 date and that indicates a change from an upward trend to a downward trend.
The 10-day moving average for SPE crossed bearishly below the 50-day moving average on October 16, 2025. This indicates that the trend has shifted lower and could be considered a sell signal. In of 13 past instances when the 10-day crossed below the 50-day, the stock continued to move higher over the following month. The odds of a continued downward trend are .
Following a 3-day decline, the stock is projected to fall further. Considering past instances where SPE declined for three days, the price rose further in of 62 cases within the following month. The odds of a continued downward trend are .
The Aroon Indicator for SPE entered a downward trend on October 21, 2025. This could indicate a strong downward move is ahead for the stock. Traders may want to consider selling the stock or buying put options.
Advertisement
General Information
Category Unknown