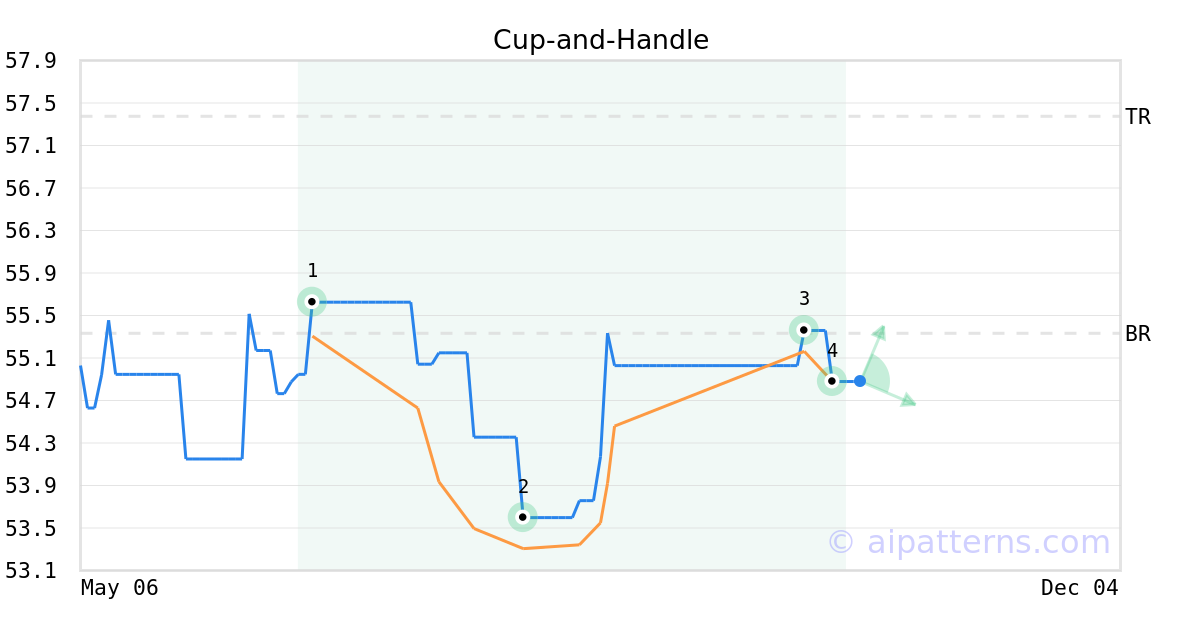
SRHR Stock Tickeron detected bullish ETF Pattern: Cup-and-Handle on October 08, 2025


at Tickeron.com


Momentum Indicator for SRHR turns positive, indicating new upward trend
SRHR saw its Momentum Indicator move above the 0 level on October 22, 2025. This is an indication that the stock could be shifting in to a new upward move. Traders may want to consider buying the stock or buying call options. Tickeron's A.I.dvisor looked at 31 similar instances where the indicator turned positive. In of the 31 cases, the stock moved higher in the following days. The odds of a move higher are at .

Technical Analysis (Indicators)
Bullish Trend Analysis
The Moving Average Convergence Divergence (MACD) for SRHR just turned positive on October 23, 2025. Looking at past instances where SRHR's MACD turned positive, the stock continued to rise in of 13 cases over the following month. The odds of a continued upward trend are .
Following a 3-day Advance, the price is estimated to grow further. Considering data from situations where SRHR advanced for three days, in of 80 cases, the price rose further within the following month. The odds of a continued upward trend are .
The Aroon Indicator entered an Uptrend today. In of 115 cases where SRHR Aroon's Indicator entered an Uptrend, the price rose further within the following month. The odds of a continued Uptrend are .
Bearish Trend Analysis
The RSI Indicator demonstrates that the ticker has stayed in the overbought zone for 4 days. The longer the ticker stays in the overbought zone, the sooner a price pull-back is expected.
The Stochastic Oscillator demonstrated that the ticker has stayed in the overbought zone for 3 days. The longer the ticker stays in the overbought zone, the sooner a price pull-back is expected.
SRHR broke above its upper Bollinger Band on October 02, 2025. This could be a sign that the stock is set to drop as the stock moves back below the upper band and toward the middle band. You may want to consider selling the stock or exploring put options.


Advertisement
General Information
Category RealEstate