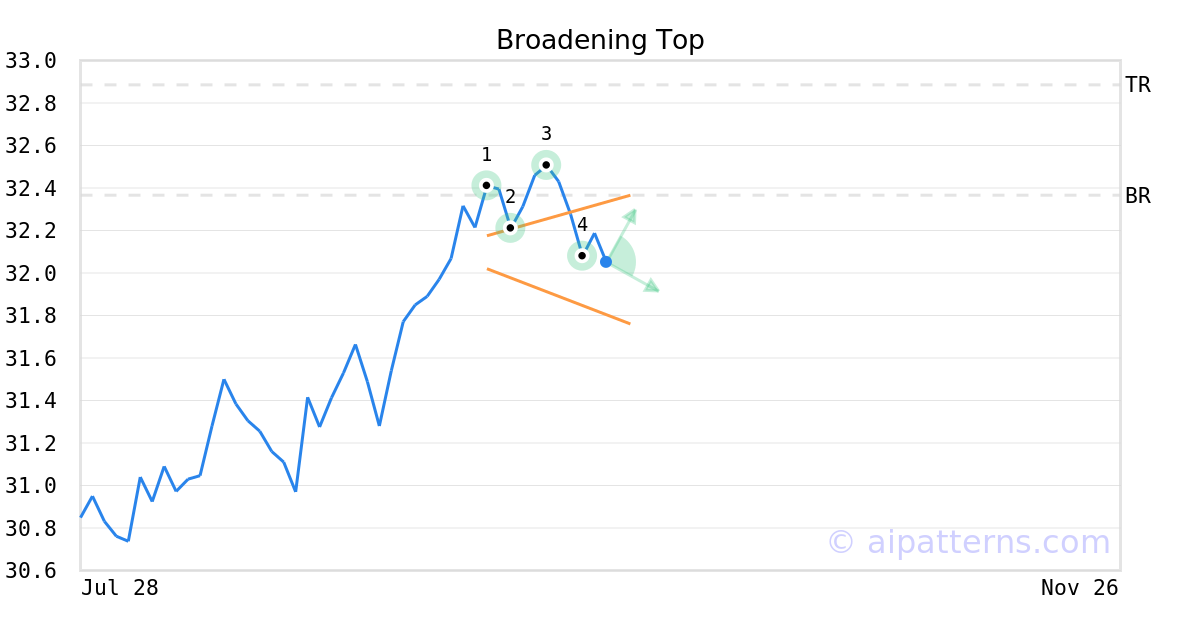
SWAN Stock Tickeron detected bullish ETF Pattern: Broadening Top on October 01, 2025


at Tickeron.com


Aroon Indicator for SWAN shows an upward move is likely
SWAN's Aroon Indicator triggered a bullish signal on September 19, 2025. Tickeron's A.I.dvisor detected that the AroonUp green line is above 70 while the AroonDown red line is below 30. When the up indicator moves above 70 and the down indicator remains below 30, it is a sign that the stock could be setting up for a bullish move. Traders may want to buy the stock or look to buy calls options. A.I.dvisor looked at 323 similar instances where the Aroon Indicator showed a similar pattern. In of the 323 cases, the stock moved higher in the days that followed. This puts the odds of a move higher at .

Technical Analysis (Indicators)
Bullish Trend Analysis
The Momentum Indicator moved above the 0 level on September 30, 2025. You may want to consider a long position or call options on SWAN as a result. In of 77 past instances where the momentum indicator moved above 0, the stock continued to climb. The odds of a continued upward trend are .
Following a 3-day Advance, the price is estimated to grow further. Considering data from situations where SWAN advanced for three days, in of 325 cases, the price rose further within the following month. The odds of a continued upward trend are .
Bearish Trend Analysis
The 10-day RSI Indicator for SWAN moved out of overbought territory on September 23, 2025. This could be a bearish sign for the stock. Traders may want to consider selling the stock or buying put options. Tickeron's A.I.dvisor looked at 44 similar instances where the indicator moved out of overbought territory. In of the 44 cases, the stock moved lower in the following days. This puts the odds of a move lower at .
The Stochastic Oscillator demonstrated that the ticker has stayed in the overbought zone for 4 days. The longer the ticker stays in the overbought zone, the sooner a price pull-back is expected.
The Moving Average Convergence Divergence Histogram (MACD) for SWAN turned negative on September 24, 2025. This could be a sign that the stock is set to turn lower in the coming weeks. Traders may want to sell the stock or buy put options. Tickeron's A.I.dvisor looked at 40 similar instances when the indicator turned negative. In of the 40 cases the stock turned lower in the days that followed. This puts the odds of success at .
Following a 3-day decline, the stock is projected to fall further. Considering past instances where SWAN declined for three days, the price rose further in of 62 cases within the following month. The odds of a continued downward trend are .
SWAN broke above its upper Bollinger Band on September 11, 2025. This could be a sign that the stock is set to drop as the stock moves back below the upper band and toward the middle band. You may want to consider selling the stock or exploring put options.


Advertisement
General Information
Category Unknown