T.X Crypto Tickeron detected bearish Crypto Pattern: Head-and-Shoulders Top on November 07, 2025


at Tickeron.com


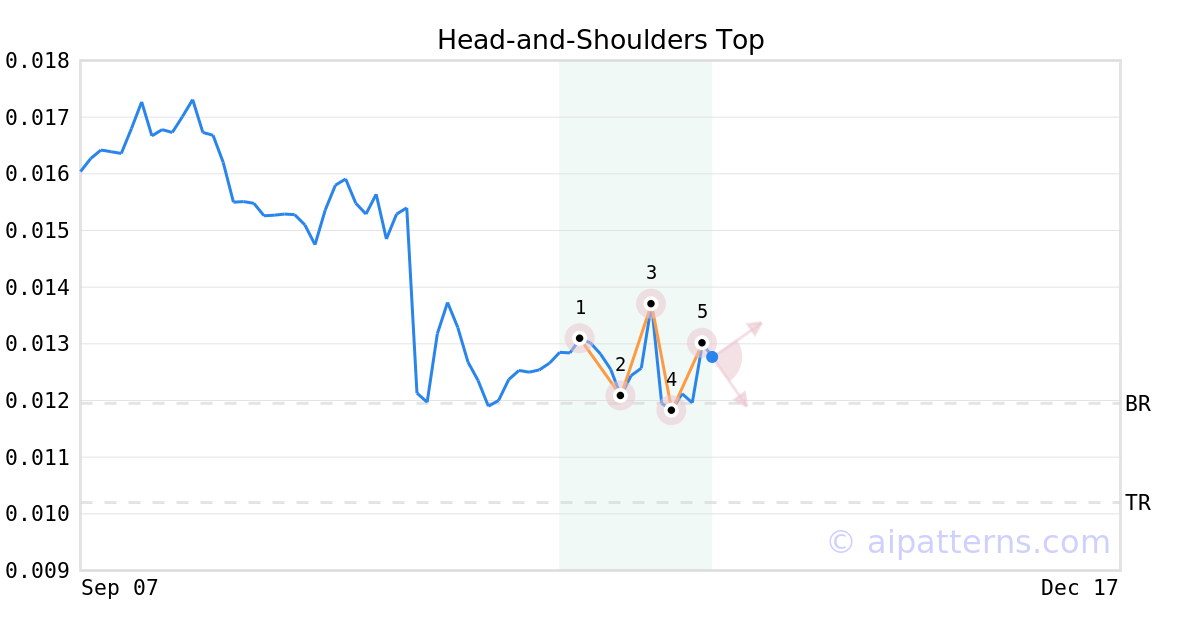
A.I.dvisor detected a bearish Head-and-Shoulders Top pattern for T.X stock. This pattern was detected on November 07, 2025 . The odds of reaching the target price are .
The pattern forms with a center peak (the Head, labeled 3) and left and right Shoulders (1, 5). Eventually the security stops testing highs and reverses trend into a decline.
Consider selling a security short before it declines or buying a put option to benefit from the price decline. To improve success chances, wait for a confirmation move: allow the price to break below the Neckline level (2, 4), which is calculated as the average of the two lows between the Head and the Shoulders.
T.X in -2.87% downward trend, sliding for three consecutive days on November 21, 2025
Moving lower for three straight days is viewed as a bearish sign. Keep an eye on this stock for future declines. Considering data from situations where T.X declined for three days, in of 329 cases, the price declined further within the following month. The odds of a continued downward trend are .

Technical Analysis (Indicators)
Bearish Trend Analysis
The Momentum Indicator moved below the 0 level on November 11, 2025. You may want to consider selling the stock, shorting the stock, or exploring put options on T.X as a result. In of 104 cases where the Momentum Indicator fell below 0, the stock fell further within the subsequent month. The odds of a continued downward trend are .
The Moving Average Convergence Divergence Histogram (MACD) for T.X turned negative on November 14, 2025. This could be a sign that the stock is set to turn lower in the coming weeks. Traders may want to sell the stock or buy put options. Tickeron's A.I.dvisor looked at 46 similar instances when the indicator turned negative. In of the 46 cases the stock turned lower in the days that followed. This puts the odds of success at .
T.X broke above its upper Bollinger Band on November 02, 2025. This could be a sign that the stock is set to drop as the stock moves back below the upper band and toward the middle band. You may want to consider selling the stock or exploring put options.
Bullish Trend Analysis
The Stochastic Oscillator shows that the ticker has stayed in the oversold zone for 8 days. The price of this ticker is presumed to bounce back soon, since the longer the ticker stays in the oversold zone, the more promptly an upward trend is expected.
Following a 3-day Advance, the price is estimated to grow further. Considering data from situations where T.X advanced for three days, in of 323 cases, the price rose further within the following month. The odds of a continued upward trend are .
The Aroon Indicator entered an Uptrend today. In of 120 cases where T.X Aroon's Indicator entered an Uptrend, the price rose further within the following month. The odds of a continued Uptrend are .