TARK Stock Tickeron detected bearish ETF Pattern: Broadening Wedge Descending TARK on November 04, 2025, netting in a 15.58% gain over 1 week


at Tickeron.com


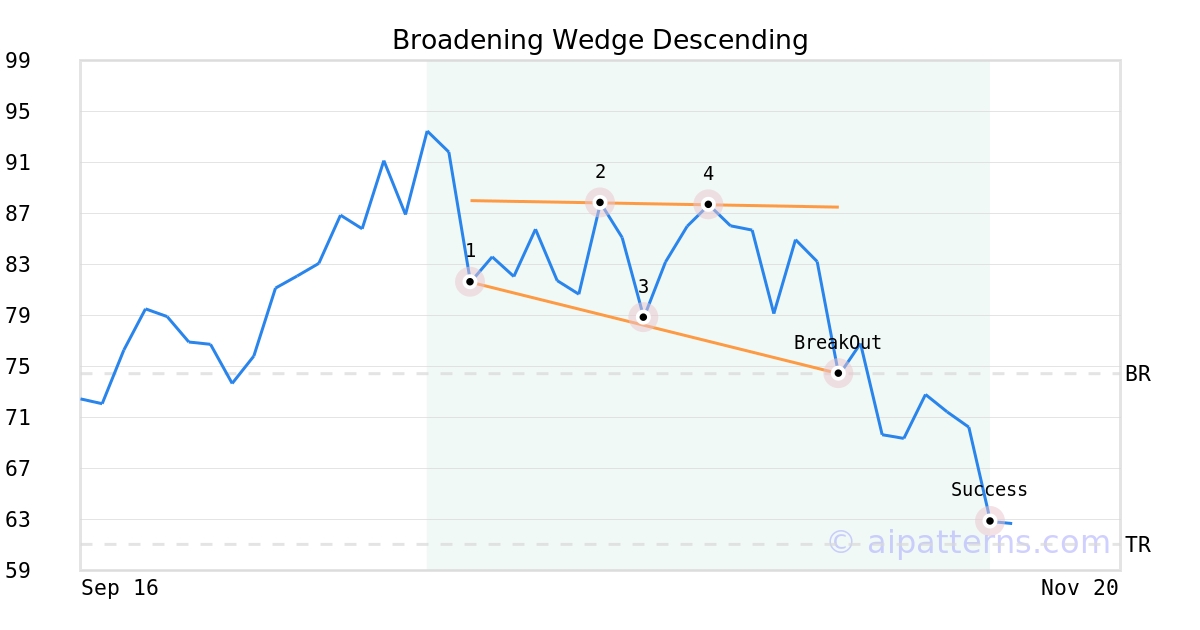
On November 04, 2025, A.I.dvisor detected a Broadening Wedge Descending Pattern (Bearish) for Tradr 2X Long Innovation ETF (TARK, $74.44). On November 04, 2025, A.I.dvisor confirmed the Bearish pattern, setting a target price of the stock. On November 13, 2025, the stock hit the target price of $61.05 – resulting in a +1 gain for traders who shorted the stock on the pattern detection date.
Momentum Indicator for TARK turns negative, indicating new downward trend
TARK saw its Momentum Indicator move below the 0 level on November 03, 2025. This is an indication that the stock could be shifting in to a new downward move. Traders may want to consider selling the stock or exploring put options. Tickeron's A.I.dvisor looked at 66 similar instances where the indicator turned negative. In of the 66 cases, the stock moved further down in the following days. The odds of a decline are at .

Technical Analysis (Indicators)
Bearish Trend Analysis
TARK moved below its 50-day moving average on November 04, 2025 date and that indicates a change from an upward trend to a downward trend.
The 10-day moving average for TARK crossed bearishly below the 50-day moving average on November 11, 2025. This indicates that the trend has shifted lower and could be considered a sell signal. In of 8 past instances when the 10-day crossed below the 50-day, the stock continued to move higher over the following month. The odds of a continued downward trend are .
Following a 3-day decline, the stock is projected to fall further. Considering past instances where TARK declined for three days, the price rose further in of 62 cases within the following month. The odds of a continued downward trend are .
The Aroon Indicator for TARK entered a downward trend on November 14, 2025. This could indicate a strong downward move is ahead for the stock. Traders may want to consider selling the stock or buying put options.
Bullish Trend Analysis
The RSI Indicator demonstrates that the ticker has stayed in the oversold zone for 2 days, which means it's wise to expect a price bounce in the near future.
The Stochastic Oscillator shows that the ticker has stayed in the oversold zone for 4 days. The price of this ticker is presumed to bounce back soon, since the longer the ticker stays in the oversold zone, the more promptly an upward trend is expected.
Following a 3-day Advance, the price is estimated to grow further. Considering data from situations where TARK advanced for three days, in of 217 cases, the price rose further within the following month. The odds of a continued upward trend are .
TARK may jump back above the lower band and head toward the middle band. Traders may consider buying the stock or exploring call options.
Advertisement
General Information
Category Trading