TVE Stock Tickeron detected bullish ETF Pattern: Three Rising Valleys on November 17, 2025


at Tickeron.com


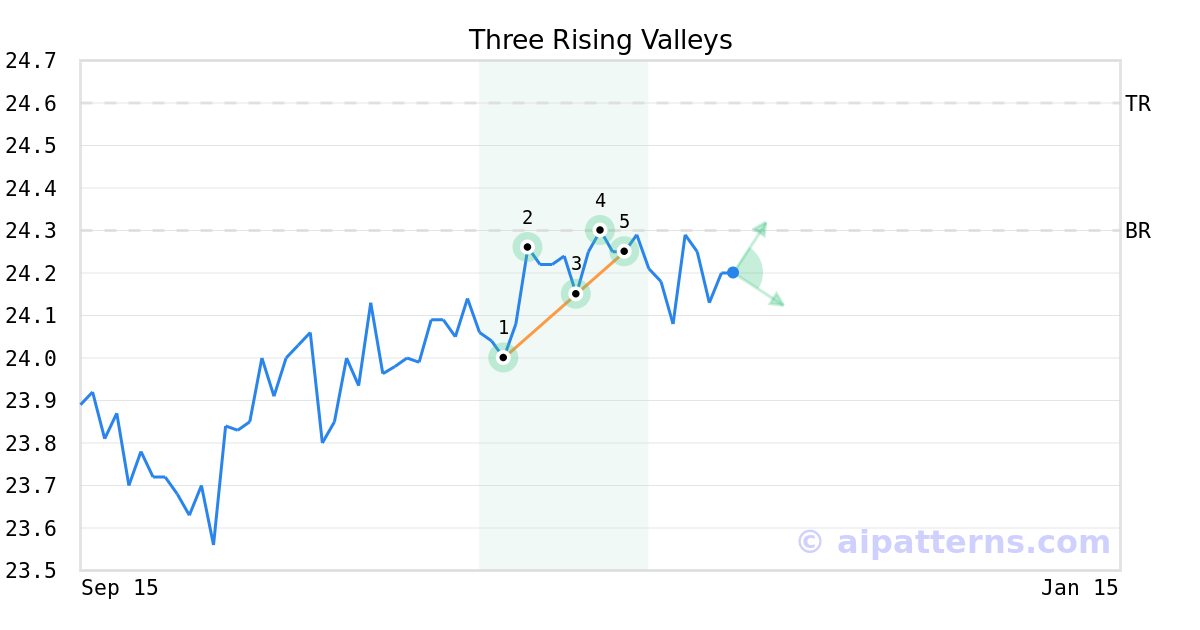
A.I.dvisor detected a bullish Three Rising Valleys pattern for TVE stock. This pattern was detected on November 17, 2025 . The odds of reaching the target price are .
The Three Rising Valleys pattern forms when three minor Lows (1, 3, 5) are arranged along an upward sloping trend line.
Consider buying a security or call option at the breakout price level. When trading, wait for the confirmation move, which is when the price rises above the breakout level.
TVE in +0.62% Uptrend, advancing for three consecutive days on November 13, 2025
Moving higher for three straight days is viewed as a bullish sign. Keep an eye on this stock for future growth. Considering data from situations where TVE advanced for three days, in of 241 cases, the price rose further within the following month. The odds of a continued upward trend are .

Technical Analysis (Indicators)
Bullish Trend Analysis
TVE may jump back above the lower band and head toward the middle band. Traders may consider buying the stock or exploring call options.
The Aroon Indicator entered an Uptrend today. In of 174 cases where TVE Aroon's Indicator entered an Uptrend, the price rose further within the following month. The odds of a continued Uptrend are .
Bearish Trend Analysis
The Stochastic Oscillator may be shifting from an upward trend to a downward trend. In of 59 cases where TVE's Stochastic Oscillator exited the overbought zone, the price fell further within the following month. The odds of a continued downward trend are .
The Momentum Indicator moved below the 0 level on November 26, 2025. You may want to consider selling the stock, shorting the stock, or exploring put options on TVE as a result. In of 128 cases where the Momentum Indicator fell below 0, the stock fell further within the subsequent month. The odds of a continued downward trend are .
The Moving Average Convergence Divergence Histogram (MACD) for TVE turned negative on November 19, 2025. This could be a sign that the stock is set to turn lower in the coming weeks. Traders may want to sell the stock or buy put options. Tickeron's A.I.dvisor looked at 50 similar instances when the indicator turned negative. In of the 50 cases the stock turned lower in the days that followed. This puts the odds of success at .
Following a 3-day decline, the stock is projected to fall further. Considering past instances where TVE declined for three days, the price rose further in of 62 cases within the following month. The odds of a continued downward trend are .
Advertisement