ULE Stock Tickeron detected bearish ETF Pattern: Cup-and-Handle Inverse ULE on October 29, 2025, netting in a 2.88% gain over 7 days


at Tickeron.com


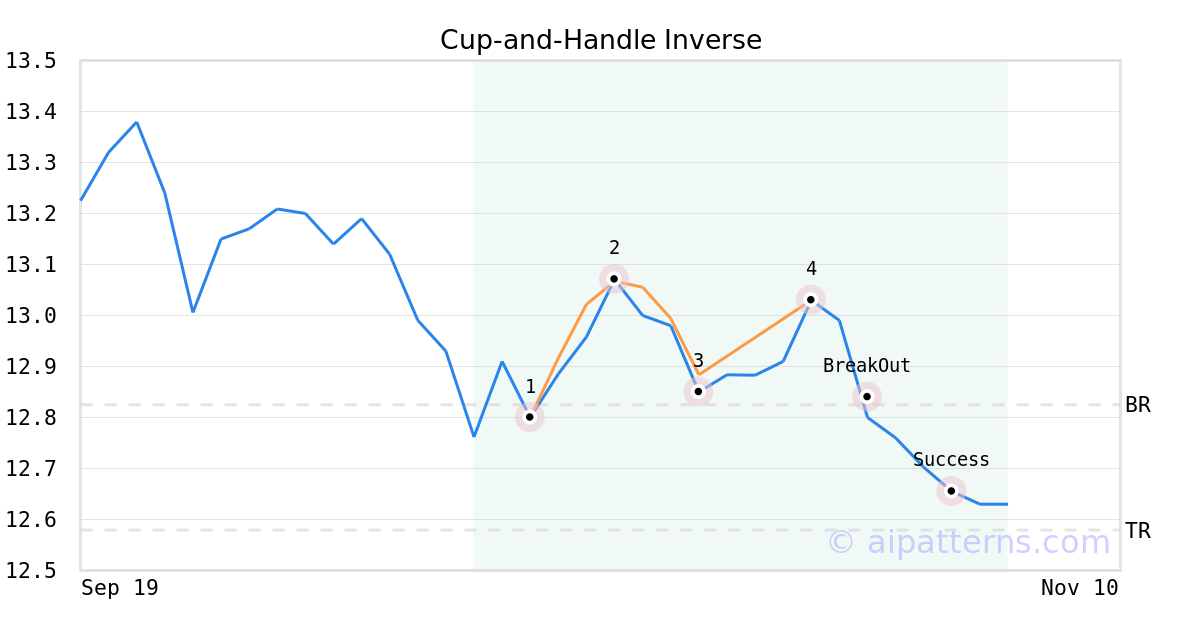
On October 27, 2025, A.I.dvisor detected a Cup-and-Handle Inverse Pattern (Bearish) for ProShares Ultra Euro (ULE, $13.03). 2 days later, on October 29, 2025, A.I.dvisor confirmed the Bearish pattern, setting a target price of the stock. On November 03, 2025, the stock hit the target price of $12.58 – resulting in a gain for traders who shorted the stock on the pattern detection date.
ULE in -0.62% downward trend, falling for three consecutive days on November 18, 2025
Moving lower for three straight days is viewed as a bearish sign. Keep an eye on this stock for future declines. Considering data from situations where ULE declined for three days, in of 300 cases, the price declined further within the following month. The odds of a continued downward trend are .

Technical Analysis (Indicators)
Bearish Trend Analysis
The Stochastic Oscillator demonstrated that the ticker has stayed in the overbought zone for 3 days. The longer the ticker stays in the overbought zone, the sooner a price pull-back is expected.
The Aroon Indicator for ULE entered a downward trend on November 14, 2025. This could indicate a strong downward move is ahead for the stock. Traders may want to consider selling the stock or buying put options.
Bullish Trend Analysis
The RSI Indicator points to a transition from a downward trend to an upward trend -- in cases where ULE's RSI Oscillator exited the oversold zone, of 41 resulted in an increase in price. Tickeron's analysis proposes that the odds of a continued upward trend are .
The Momentum Indicator moved above the 0 level on November 13, 2025. You may want to consider a long position or call options on ULE as a result. In of 85 past instances where the momentum indicator moved above 0, the stock continued to climb. The odds of a continued upward trend are .
The Moving Average Convergence Divergence (MACD) for ULE just turned positive on November 11, 2025. Looking at past instances where ULE's MACD turned positive, the stock continued to rise in of 51 cases over the following month. The odds of a continued upward trend are .
Following a 3-day Advance, the price is estimated to grow further. Considering data from situations where ULE advanced for three days, in of 270 cases, the price rose further within the following month. The odds of a continued upward trend are .
ULE may jump back above the lower band and head toward the middle band. Traders may consider buying the stock or exploring call options.
Advertisement
General Information
Category Trading