VGM Stock Tickeron detected bullish ETF Pattern: Triangle Symmetrical Top on November 26, 2025


at Tickeron.com


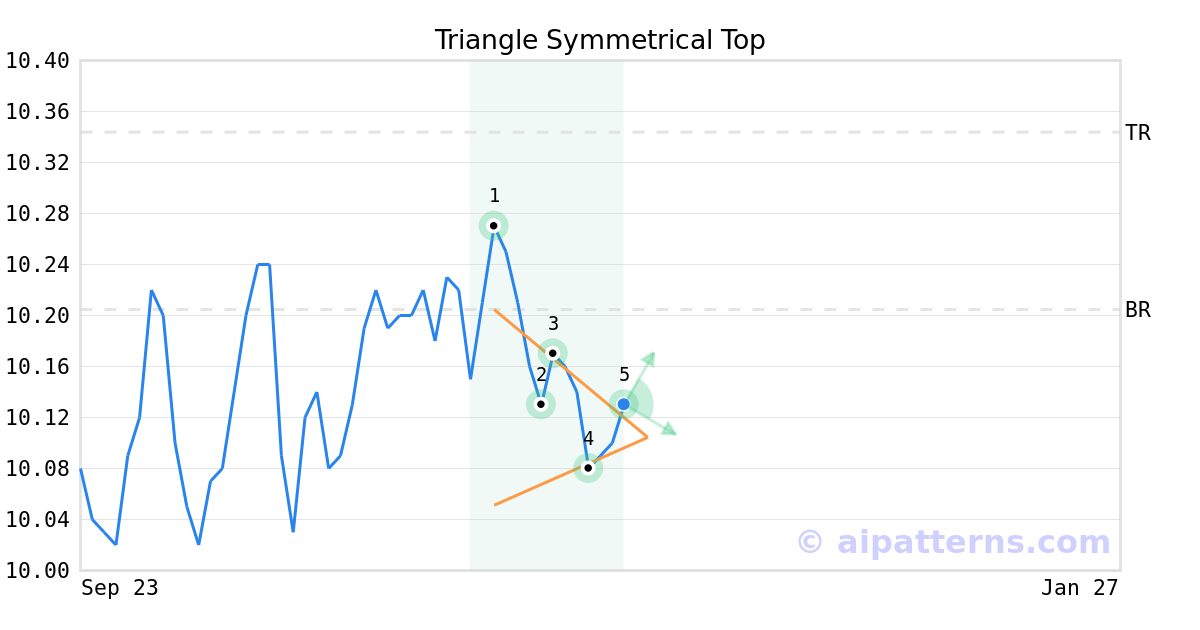
A.I.dvisor detected a bullish Triangle Symmetrical Top pattern for VGM stock. This pattern was detected on November 26, 2025 . The odds of reaching the target price are 6.
The Symmetrical Triangle Top pattern forms when the price of a security fails to retest a high or low and ultimately forms two narrowing trend lines.
Consider buying a security or call option at the breakout price level. When trading, wait for the confirmation move, which is when the price rises above the breakout level.
VGM in +0.59% Uptrend, growing for three consecutive days on December 01, 2025
Moving higher for three straight days is viewed as a bullish sign. Keep an eye on this stock for future growth. Considering data from situations where VGM advanced for three days, in of 306 cases, the price rose further within the following month. The odds of a continued upward trend are .

Technical Analysis (Indicators)
Bullish Trend Analysis
The Momentum Indicator moved above the 0 level on November 28, 2025. You may want to consider a long position or call options on VGM as a result. In of 79 past instances where the momentum indicator moved above 0, the stock continued to climb. The odds of a continued upward trend are .
The Aroon Indicator entered an Uptrend today. In of 216 cases where VGM Aroon's Indicator entered an Uptrend, the price rose further within the following month. The odds of a continued Uptrend are .
Bearish Trend Analysis
The Stochastic Oscillator entered the overbought zone. Expect a price pull-back in the foreseeable future.
Following a 3-day decline, the stock is projected to fall further. Considering past instances where VGM declined for three days, the price rose further in of 62 cases within the following month. The odds of a continued downward trend are .
Advertisement
General Information
Category Unknown