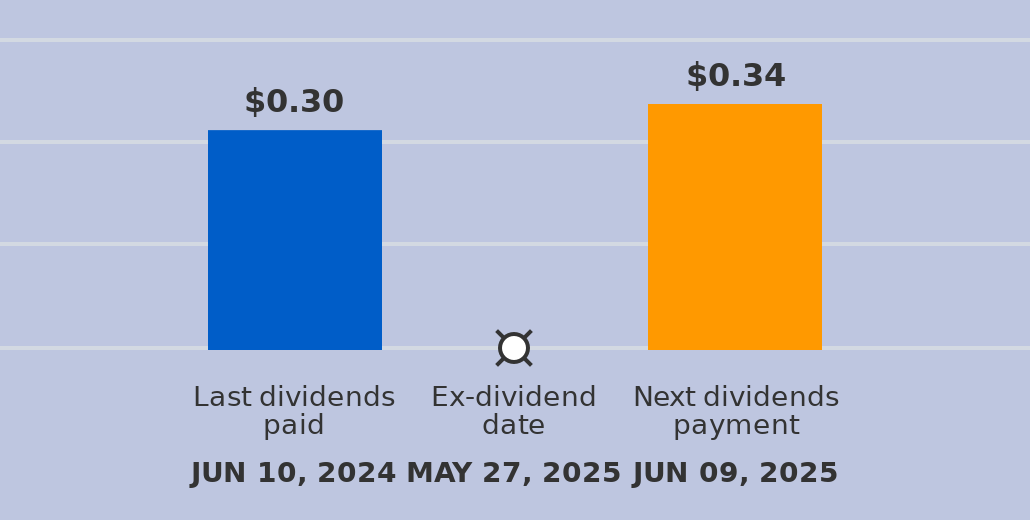
VNRFY Stock Vienna Insurance Group (VNRFY) is expected to pay dividends on June 09, 2025


at Tickeron.com
VNRFY in upward trend: price rose above 50-day moving average on October 07, 2025
VNRFY moved above its 50-day moving average on October 07, 2025 date and that indicates a change from a downward trend to an upward trend. In of 10 similar past instances, the stock price increased further within the following month. The odds of a continued upward trend are .

Technical Analysis (Indicators)
Bullish Trend Analysis
The Stochastic Oscillator demonstrated that the ticker has stayed in the oversold zone for 2 days, which means it's wise to expect a price bounce in the near future.
The Momentum Indicator moved above the 0 level on September 23, 2025. You may want to consider a long position or call options on VNRFY as a result. In of 23 past instances where the momentum indicator moved above 0, the stock continued to climb. The odds of a continued upward trend are .
The Moving Average Convergence Divergence (MACD) for VNRFY just turned positive on September 30, 2025. Looking at past instances where VNRFY's MACD turned positive, the stock continued to rise in of 24 cases over the following month. The odds of a continued upward trend are .
The 10-day moving average for VNRFY crossed bullishly above the 50-day moving average on October 15, 2025. This indicates that the trend has shifted higher and could be considered a buy signal. In of 9 past instances when the 10-day crossed above the 50-day, the stock continued to move higher over the following month. The odds of a continued upward trend are .
Bearish Trend Analysis
The RSI Indicator demonstrates that the ticker has stayed in the overbought zone for 13 days. The longer the ticker stays in the overbought zone, the sooner a price pull-back is expected.
The Aroon Indicator for VNRFY entered a downward trend on October 10, 2025. This could indicate a strong downward move is ahead for the stock. Traders may want to consider selling the stock or buying put options.
Fundamental Analysis (Ratings)
The Tickeron Profit vs. Risk Rating rating for this company is (best 1 - 100 worst), indicating low risk on high returns. The average Profit vs. Risk Rating rating for the industry is 41, placing this stock better than average.
The Tickeron PE Growth Rating for this company is (best 1 - 100 worst), pointing to outstanding earnings growth. The PE Growth rating is based on a comparative analysis of stock PE ratio increase over the last 12 months compared against S&P 500 index constituents.
The Tickeron Price Growth Rating for this company is (best 1 - 100 worst), indicating steady price growth. VNRFY’s price grows at a higher rate over the last 12 months as compared to S&P 500 index constituents.
The Tickeron Valuation Rating of (best 1 - 100 worst) indicates that the company is fair valued in the industry. This rating compares market capitalization estimated by our proprietary formula with the current market capitalization. This rating is based on the following metrics, as compared to industry averages: P/B Ratio (0.934) is normal, around the industry mean (1.980). P/E Ratio (9.183) is within average values for comparable stocks, (14.127). VNRFY's Projected Growth (PEG Ratio) (0.000) is very low in comparison to the industry average of (1.438). Dividend Yield (0.031) settles around the average of (0.046) among similar stocks. P/S Ratio (0.479) is also within normal values, averaging (1.443).
The Tickeron SMR rating for this company is (best 1 - 100 worst), indicating weak sales and an unprofitable business model. SMR (Sales, Margin, Return on Equity) rating is based on comparative analysis of weighted Sales, Income Margin and Return on Equity values compared against S&P 500 index constituents. The weighted SMR value is a proprietary formula developed by Tickeron and represents an overall profitability measure for a stock.


Advertisement
General Information
Industry MultiLineInsurance