WDIV Stock Tickeron detected bullish ETF Pattern: Cup-and-Handle WDIV on October 16, 2025, netting in a 2.77% gain over 1 month


at Tickeron.com


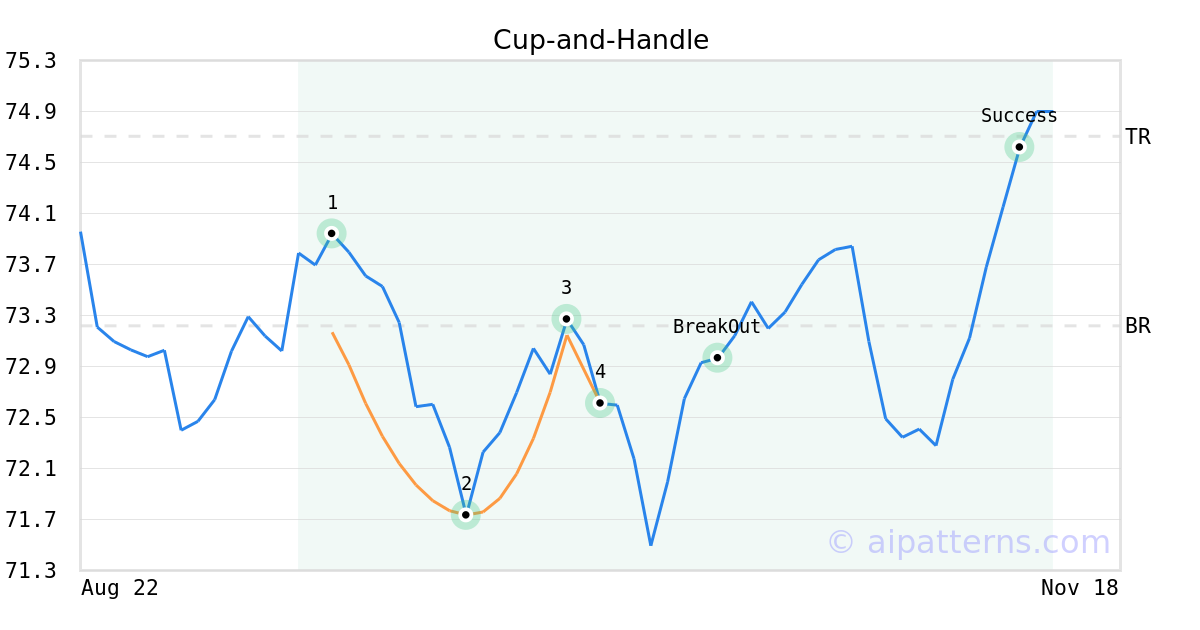
On October 07, 2025, A.I.dvisor detected a Cup-and-Handle Pattern (Bullish) for SPDR® S&P Global Dividend ETF (WDIV, $72.61). On October 16, 2025, A.I.dvisor confirmed the Bullish pattern, setting a target price of $74.71. 26 days later, on November 11, 2025, WDIV reached the target price resulting in a for traders who took a long position in the stock.
WDIV in +1.01% Uptrend, advancing for three consecutive days on November 12, 2025
Moving higher for three straight days is viewed as a bullish sign. Keep an eye on this stock for future growth. Considering data from situations where WDIV advanced for three days, in of 365 cases, the price rose further within the following month. The odds of a continued upward trend are .

Technical Analysis (Indicators)
Bullish Trend Analysis
The Stochastic Oscillator demonstrated that the ticker has stayed in the oversold zone for 1 day, which means it's wise to expect a price bounce in the near future.
The Momentum Indicator moved above the 0 level on November 21, 2025. You may want to consider a long position or call options on WDIV as a result. In of 79 past instances where the momentum indicator moved above 0, the stock continued to climb. The odds of a continued upward trend are .
WDIV moved above its 50-day moving average on November 21, 2025 date and that indicates a change from a downward trend to an upward trend.
The Aroon Indicator entered an Uptrend today. In of 341 cases where WDIV Aroon's Indicator entered an Uptrend, the price rose further within the following month. The odds of a continued Uptrend are .
Bearish Trend Analysis
The 10-day RSI Indicator for WDIV moved out of overbought territory on November 13, 2025. This could be a bearish sign for the stock. Traders may want to consider selling the stock or buying put options. Tickeron's A.I.dvisor looked at 54 similar instances where the indicator moved out of overbought territory. In of the 54 cases, the stock moved lower in the following days. This puts the odds of a move lower at .
The Moving Average Convergence Divergence Histogram (MACD) for WDIV turned negative on November 19, 2025. This could be a sign that the stock is set to turn lower in the coming weeks. Traders may want to sell the stock or buy put options. Tickeron's A.I.dvisor looked at 48 similar instances when the indicator turned negative. In of the 48 cases the stock turned lower in the days that followed. This puts the odds of success at .
Following a 3-day decline, the stock is projected to fall further. Considering past instances where WDIV declined for three days, the price rose further in of 62 cases within the following month. The odds of a continued downward trend are .
Advertisement
General Information
Category ForeignLargeValue