WOR Stock Tickeron detected bullish Stock Pattern: Head-and-Shoulders Bottom on November 28, 2025


at Tickeron.com


A.I.dvisor detected a bullish Head-and-Shoulders Bottom pattern for WOR stock. This pattern was detected on November 28, 2025 . The odds of reaching the target price are 6.
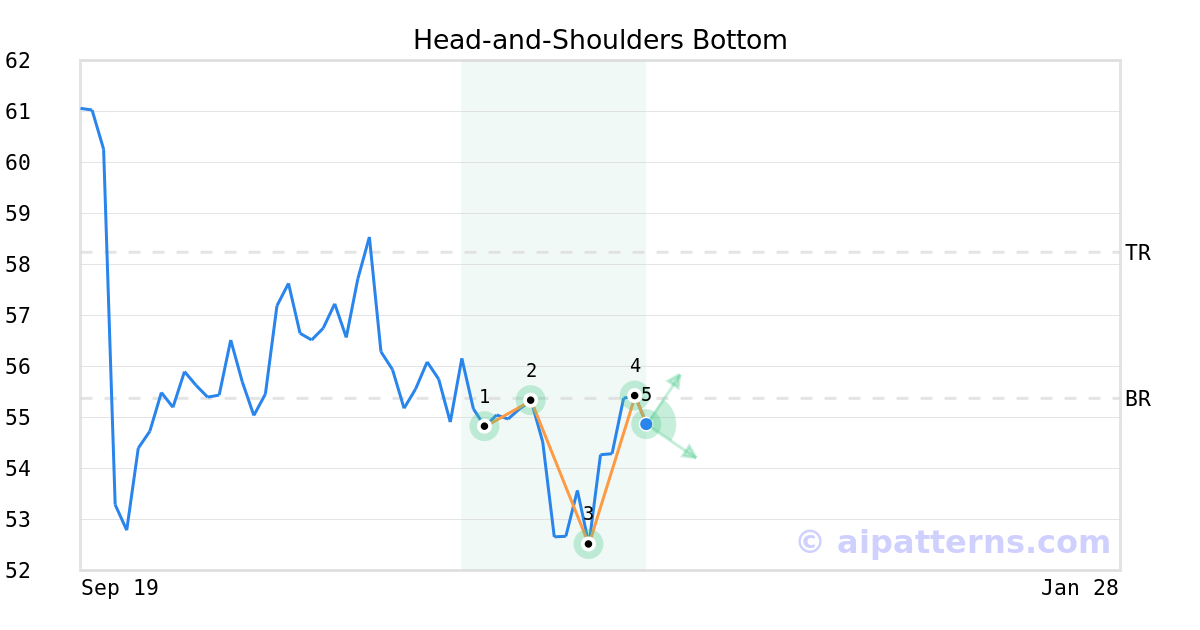
The Head-and-Shoulders Bottom pattern is formed when the price of a security creates a center trough (the inverted head, labeled 3) and the left and right inverted shoulders (1, 5). After reaching the lowest low (the Head, 3) the next low is shallower and the trend reverses course to the upside.
Consider buying a security or a call option at the low once the pattern is confirmed, which is known as the breakout point. The pattern is confirmed when the price breaks above the Neckline (2,4).
WOR in upward trend: price expected to rise as it breaks its lower Bollinger Band on November 17, 2025
WOR may jump back above the lower band and head toward the middle band. Traders may consider buying the stock or exploring call options. In of 35 cases where WOR's price broke its lower Bollinger Band, its price rose further in the following month. The odds of a continued upward trend are .

Technical Analysis (Indicators)
Bullish Trend Analysis
The RSI Oscillator points to a transition from a downward trend to an upward trend -- in cases where WOR's RSI Indicator exited the oversold zone, of 24 resulted in an increase in price. Tickeron's analysis proposes that the odds of a continued upward trend are .
The Moving Average Convergence Divergence (MACD) for WOR just turned positive on November 24, 2025. Looking at past instances where WOR's MACD turned positive, the stock continued to rise in of 45 cases over the following month. The odds of a continued upward trend are .
Following a 3-day Advance, the price is estimated to grow further. Considering data from situations where WOR advanced for three days, in of 314 cases, the price rose further within the following month. The odds of a continued upward trend are .
Bearish Trend Analysis
The Stochastic Oscillator has been in the overbought zone for 1 day. Expect a price pull-back in the near future.
The Momentum Indicator moved below the 0 level on November 28, 2025. You may want to consider selling the stock, shorting the stock, or exploring put options on WOR as a result. In of 77 cases where the Momentum Indicator fell below 0, the stock fell further within the subsequent month. The odds of a continued downward trend are .
Following a 3-day decline, the stock is projected to fall further. Considering past instances where WOR declined for three days, the price rose further in of 62 cases within the following month. The odds of a continued downward trend are .
The Aroon Indicator for WOR entered a downward trend on November 28, 2025. This could indicate a strong downward move is ahead for the stock. Traders may want to consider selling the stock or buying put options.
Fundamental Analysis (Ratings)
The Tickeron PE Growth Rating for this company is (best 1 - 100 worst), pointing to outstanding earnings growth. The PE Growth rating is based on a comparative analysis of stock PE ratio increase over the last 12 months compared against S&P 500 index constituents.
The Tickeron Profit vs. Risk Rating rating for this company is (best 1 - 100 worst), indicating well-balanced risk and returns. The average Profit vs. Risk Rating rating for the industry is 70, placing this stock slightly better than average.
The Tickeron Price Growth Rating for this company is (best 1 - 100 worst), indicating fairly steady price growth. WOR’s price grows at a lower rate over the last 12 months as compared to S&P 500 index constituents.
The Tickeron SMR rating for this company is (best 1 - 100 worst), indicating strong sales and a profitable business model. SMR (Sales, Margin, Return on Equity) rating is based on comparative analysis of weighted Sales, Income Margin and Return on Equity values compared against S&P 500 index constituents. The weighted SMR value is a proprietary formula developed by Tickeron and represents an overall profitability measure for a stock.
The Tickeron Valuation Rating of (best 1 - 100 worst) indicates that the company is slightly overvalued in the industry. This rating compares market capitalization estimated by our proprietary formula with the current market capitalization. This rating is based on the following metrics, as compared to industry averages: P/B Ratio (2.846) is normal, around the industry mean (43.543). WOR's P/E Ratio (249.773) is considerably higher than the industry average of (46.663). WOR's Projected Growth (PEG Ratio) (0.000) is very low in comparison to the industry average of (1.262). Dividend Yield (0.013) settles around the average of (0.021) among similar stocks. P/S Ratio (2.291) is also within normal values, averaging (350.559).
Advertisement
General Information
a developer of flat-rolled steels
Industry MetalFabrication