XRX Stock Tickeron detected bearish Stock Pattern: Cup-and-Handle Inverse XRX on November 03, 2025, netting in a 21.69% gain over 2 weeks


at Tickeron.com


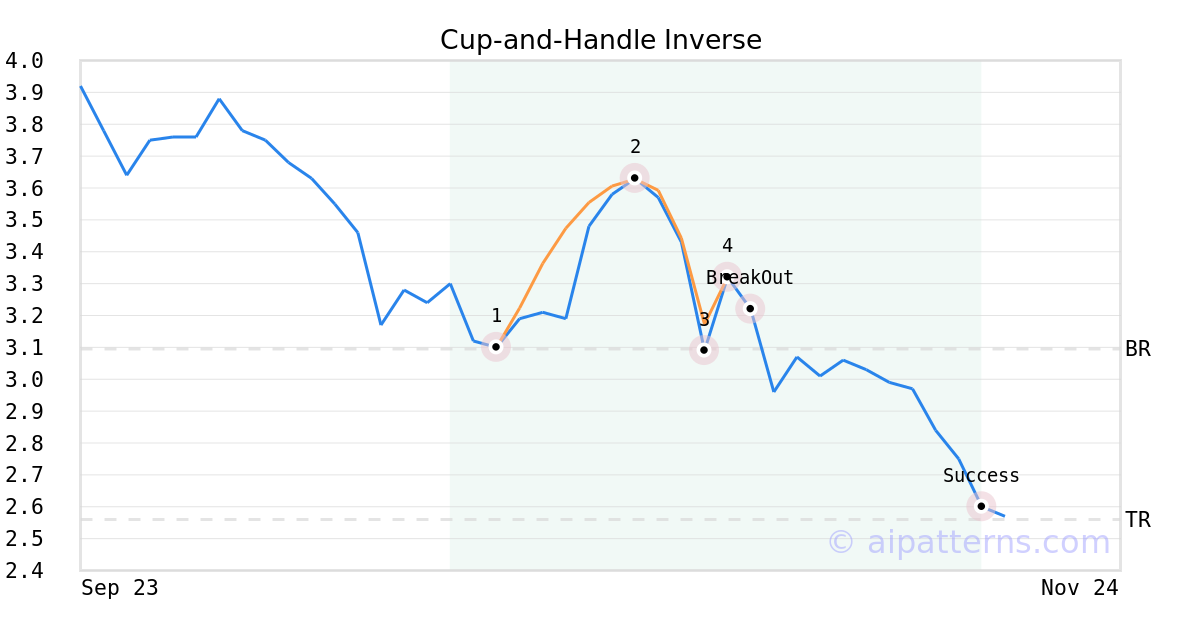
On October 31, 2025, A.I.dvisor detected a Cup-and-Handle Inverse Pattern (Bearish) for Xerox Holdings Corp (XRX, $3.32). 3 days later, on November 03, 2025, A.I.dvisor confirmed the Bearish pattern, setting a target price of the stock. On November 17, 2025, the stock hit the target price of $2.56 – resulting in a +2 gain for traders who shorted the stock on the pattern detection date.
XRX sees MACD Histogram just turned negative
XRX saw its Moving Average Convergence Divergence Histogram (MACD) turn negative on November 04, 2025. This is a bearish signal that suggests the stock could decline going forward. Tickeron's A.I.dvisor looked at 46 instances where the indicator turned negative. In of the 46 cases the stock moved lower in the days that followed. This puts the odds of a downward move at .

Technical Analysis (Indicators)
Bearish Trend Analysis
The Momentum Indicator moved below the 0 level on November 04, 2025. You may want to consider selling the stock, shorting the stock, or exploring put options on XRX as a result. In of 99 cases where the Momentum Indicator fell below 0, the stock fell further within the subsequent month. The odds of a continued downward trend are .
Following a 3-day decline, the stock is projected to fall further. Considering past instances where XRX declined for three days, the price rose further in of 62 cases within the following month. The odds of a continued downward trend are .
The Aroon Indicator for XRX entered a downward trend on November 11, 2025. This could indicate a strong downward move is ahead for the stock. Traders may want to consider selling the stock or buying put options.
Bullish Trend Analysis
The RSI Indicator shows that the ticker has stayed in the oversold zone for 3 days. The price of this ticker is presumed to bounce back soon, since the longer the ticker stays in the oversold zone, the more promptly an Uptrend is expected.
The Stochastic Oscillator shows that the ticker has stayed in the oversold zone for 12 days. The price of this ticker is presumed to bounce back soon, since the longer the ticker stays in the oversold zone, the more promptly an upward trend is expected.
Following a 3-day Advance, the price is estimated to grow further. Considering data from situations where XRX advanced for three days, in of 285 cases, the price rose further within the following month. The odds of a continued upward trend are .
XRX may jump back above the lower band and head toward the middle band. Traders may consider buying the stock or exploring call options.
Fundamental Analysis (Ratings)
The Tickeron Valuation Rating of (best 1 - 100 worst) indicates that the company is seriously undervalued in the industry. This rating compares market capitalization estimated by our proprietary formula with the current market capitalization. This rating is based on the following metrics, as compared to industry averages: P/B Ratio (0.891) is normal, around the industry mean (9.803). P/E Ratio (0.000) is within average values for comparable stocks, (50.689). XRX's Projected Growth (PEG Ratio) (0.152) is slightly lower than the industry average of (1.421). XRX's Dividend Yield (0.167) is considerably higher than the industry average of (0.026). P/S Ratio (0.048) is also within normal values, averaging (35.527).
The Tickeron PE Growth Rating for this company is (best 1 - 100 worst), pointing to outstanding earnings growth. The PE Growth rating is based on a comparative analysis of stock PE ratio increase over the last 12 months compared against S&P 500 index constituents.
The Tickeron Price Growth Rating for this company is (best 1 - 100 worst), indicating slightly worse than average price growth. XRX’s price grows at a lower rate over the last 12 months as compared to S&P 500 index constituents.
The Tickeron Seasonality Score of (best 1 - 100 worst) indicates that the company is significantly overvalued in the industry. The Tickeron Seasonality score describes the variance of predictable price changes around the same period every calendar year. These changes can be tied to a specific month, quarter, holiday or vacation period, as well as a meteorological or growing season.
The Tickeron SMR rating for this company is (best 1 - 100 worst), indicating weak sales and an unprofitable business model. SMR (Sales, Margin, Return on Equity) rating is based on comparative analysis of weighted Sales, Income Margin and Return on Equity values compared against S&P 500 index constituents. The weighted SMR value is a proprietary formula developed by Tickeron and represents an overall profitability measure for a stock.
The Tickeron Profit vs. Risk Rating rating for this company is (best 1 - 100 worst), indicating that the returns do not compensate for the risks. XRX’s unstable profits reported over time resulted in significant Drawdowns within these last five years. A stable profit reduces stock drawdown and volatility. The average Profit vs. Risk Rating rating for the industry is 84, placing this stock worse than average.
Advertisement
General Information
a devloper of document management systems and solutions
Industry InformationTechnologyServices