YCL Stock Tickeron detected bearish ETF Pattern: Broadening Bottom YCL on October 07, 2025, netting in a 5.16% gain over 1 month


at Tickeron.com


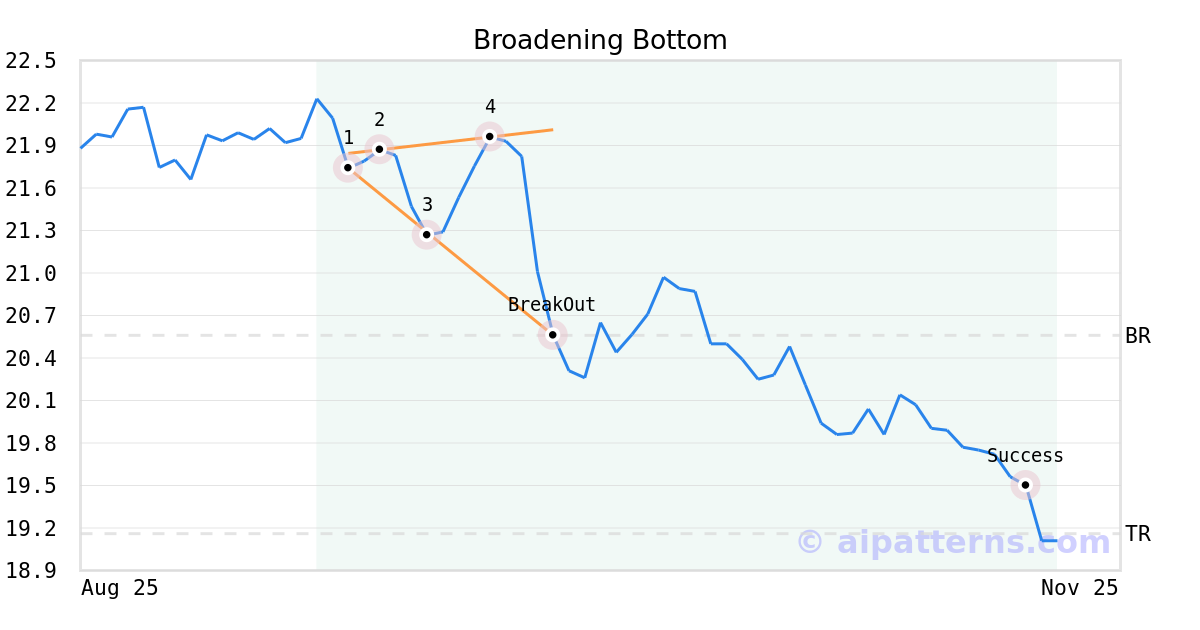
On October 07, 2025, A.I.dvisor detected a Broadening Bottom Pattern (Bearish) for ProShares Ultra Yen (YCL, $20.56). On October 07, 2025, A.I.dvisor confirmed the Bearish pattern, setting a target price of the stock. On November 18, 2025, the stock hit the target price of $19.16 – resulting in a gain for traders who shorted the stock on the pattern detection date.
Momentum Indicator for YCL turns negative, indicating new downward trend
YCL saw its Momentum Indicator move below the 0 level on October 24, 2025. This is an indication that the stock could be shifting in to a new downward move. Traders may want to consider selling the stock or exploring put options. Tickeron's A.I.dvisor looked at 81 similar instances where the indicator turned negative. In of the 81 cases, the stock moved further down in the following days. The odds of a decline are at .

Technical Analysis (Indicators)
Bearish Trend Analysis
Following a 3-day decline, the stock is projected to fall further. Considering past instances where YCL declined for three days, the price rose further in of 62 cases within the following month. The odds of a continued downward trend are .
The Aroon Indicator for YCL entered a downward trend on November 28, 2025. This could indicate a strong downward move is ahead for the stock. Traders may want to consider selling the stock or buying put options.
Bullish Trend Analysis
The RSI Oscillator points to a transition from a downward trend to an upward trend -- in cases where YCL's RSI Oscillator exited the oversold zone, of 51 resulted in an increase in price. Tickeron's analysis proposes that the odds of a continued upward trend are .
The Stochastic Oscillator suggests the stock price trend may be in a reversal from a downward trend to an upward trend. of 69 cases where YCL's Stochastic Oscillator exited the oversold zone resulted in an increase in price. Tickeron's analysis proposes that the odds of a continued upward trend are .
The Moving Average Convergence Divergence (MACD) for YCL just turned positive on November 28, 2025. Looking at past instances where YCL's MACD turned positive, the stock continued to rise in of 52 cases over the following month. The odds of a continued upward trend are .
Following a 3-day Advance, the price is estimated to grow further. Considering data from situations where YCL advanced for three days, in of 231 cases, the price rose further within the following month. The odds of a continued upward trend are .
YCL may jump back above the lower band and head toward the middle band. Traders may consider buying the stock or exploring call options.
Advertisement
General Information
Category Trading