Microsoft (MSFT) Stock Compare, prediction. How to Compare?
Microsoft develops and licenses consumer and enterprise software... Show more
How to Select the Best out of 2 or 3 Stocks
In the digital age, where financial markets are at one's fingertips, comparing stock tickers efficiently is paramount for investors aiming to make informed decisions. Tickeron, an AI-driven financial information platform, offers a comprehensive tool for this purpose. This article is divided into two sections: the first part guides you through the process of comparing two or three tickers using Tickeron, and the second part explores the features available on the Compare page.
How to Start Comparing
To embark on a comparison journey with Tickeron, follow these simple steps:
Access Tickeron: Begin by visiting the Tickeron website. If you're not already a member, you may need to sign up or log in to access the full suite of tools.
Navigate to the Comparison Tool: Within Tickeron's dashboard, locate the "Compare" feature. This tool is designed to facilitate the side-by-side evaluation of multiple stock tickers.
Select Your Tickers: You can compare two or three tickers simultaneously. Enter the ticker symbols in the designated search boxes. These symbols represent the stocks you wish to compare.
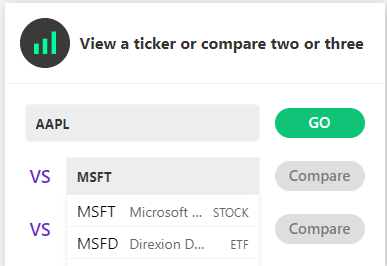
Example: Enter the ticker of your interest in the second field to compare two tickers. Should you input a third ticker in the designated third field, you will have the capability to compare three tickers.
Initiate the Comparison: After entering the ticker symbols, proceed to launch the comparison. Tickeron will then generate a comprehensive comparative analysis based on the selected tickers.
How to Interpret the Results
The Compare page on Tickeron is meticulously designed to offer a wealth of information, making it easier for investors to grasp the nuances of each stock. Here are the key features you'll encounter:
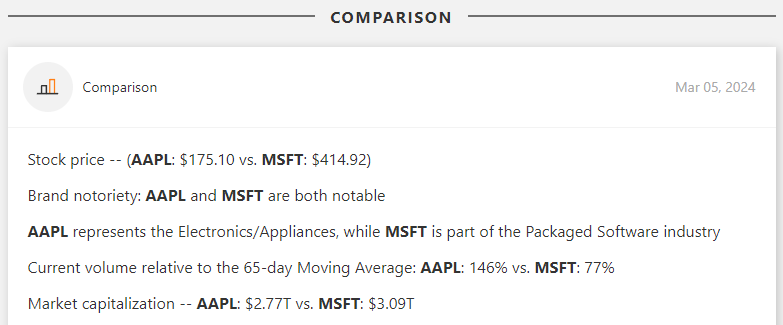
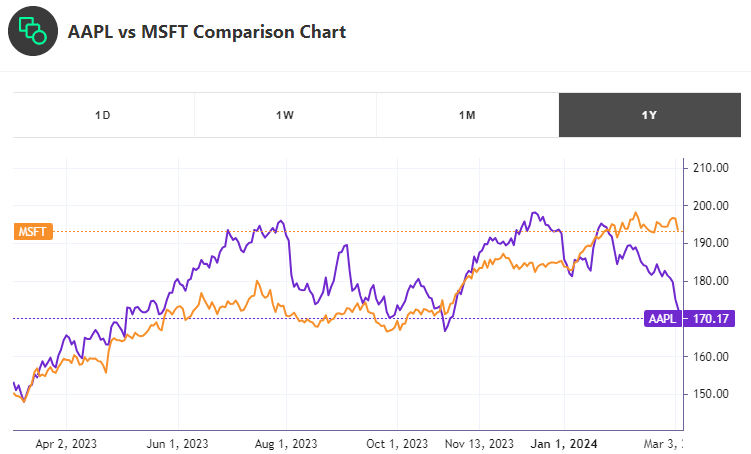
Compare Chart
You will have the chance to compare two or three companies using one or more charts, ensuring a thorough examination of their performances.
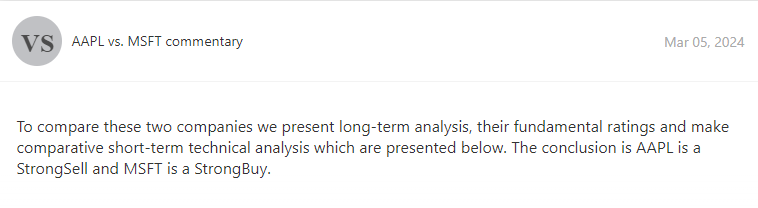
Commentary
Tile with Short Descriptions: This section provides an overview of the tickers being compared, offering brief descriptions that highlight key aspects and initial insights.
How to use it in Trading
Tickeron's Compare feature stands out as a critical tool for traders looking to perform thorough comparisons between two or three stock tickers. It combines brief summaries, detailed analyses, and a wide range of metrics and evaluations. This facilitates the development of comprehensive investment strategies based on a deep comprehension of the stocks in question. When selecting stocks for trading, the ability to access such a breadth of information through Tickeron's Compare function can significantly enhance decision-making, making it an advisable choice for informed trading endeavors.
Example of Comparison
Tile with Detailed Descriptions: Delve deeper into the specifics of each stock with detailed comparisons, including:
- Short-Term Analysis: Insight into the stock's potential performance shortly.
- Long-Term Analysis: An evaluation of the stock's prospects over an extended period.
- FA Score: A fundamental analysis score that assesses the stock's financial health and potential.
- TA Score Indicator(s): Technical analysis scores that indicate the stock's current market trends.
- Price Growth: Examination of the stock's price appreciation or depreciation over time.
- Reported Earning Dates: Important dates when the companies report their earnings, can significantly impact stock prices.
- Industries' Descriptions: Information about the sectors in which the companies operate, providing context for their performance.
You can explore a detailed article that compares two or three stock symbols, where you will find only the facts and news that capture your interest.
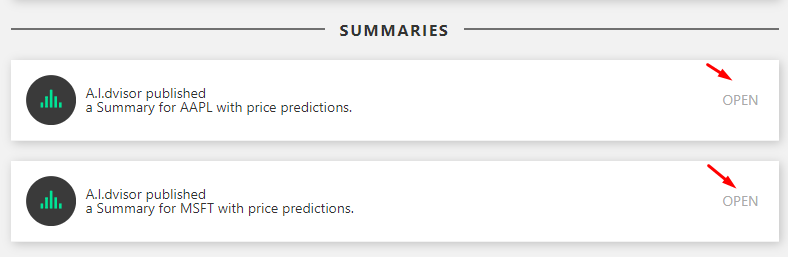
Example of Ticker Summary
A concise summary for each ticker, offering a snapshot of its current status and performance indicators.
You will also have the chance to explore individual articles about each of the tickers, which include Technical Analysis and Fundamental Analysis.
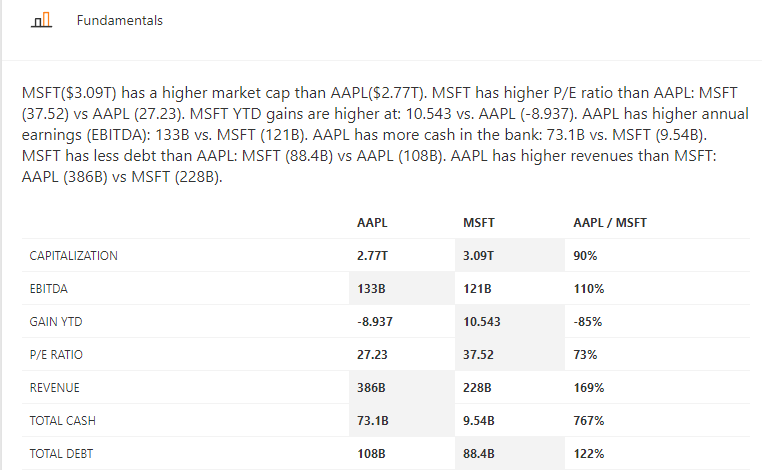
Example of FUNDAMENTALS
A deep dive into the financial fundamentals of the companies, including revenue, profit margins, and other key financial metrics.

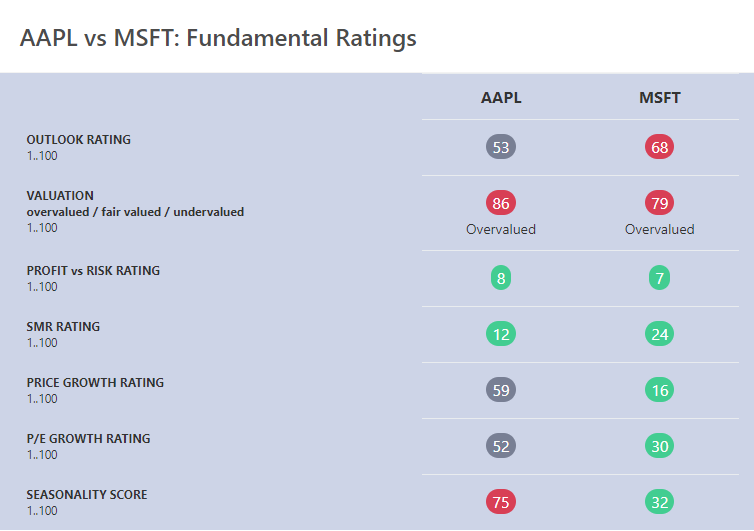
Example of FUNDAMENTALS RATINGS
Ratings based on fundamental analysis, give investors a quick understanding of the stock's financial standing.
Example of TECHNICAL ANALYSIS
This section provides insights derived from technical analysis, including trend patterns, support and resistance levels, and other technical indicators.


Advertisement
General Information
a developer of software and harware products
Industry PackagedSoftware