


The Reasons Behind HOOD's Ascent to All-Time Highs: Robinhood's Amazing 230% Rally
Robinhood Markets, Inc. (HOOD) delivered one of 2025's most remarkable stock performance stories, surging approximately 230% from its April 7 low of $29.66 to its July 2 closing price of $97.98. This extraordinary rally, which propelled the stock to all-time highs, was driven by a confluence of factors including exceptional Q1 2025 earnings results, aggressive international expansion, revolutionary crypto innovations, and strategic positioning in the rapidly evolving financial technology landscape.
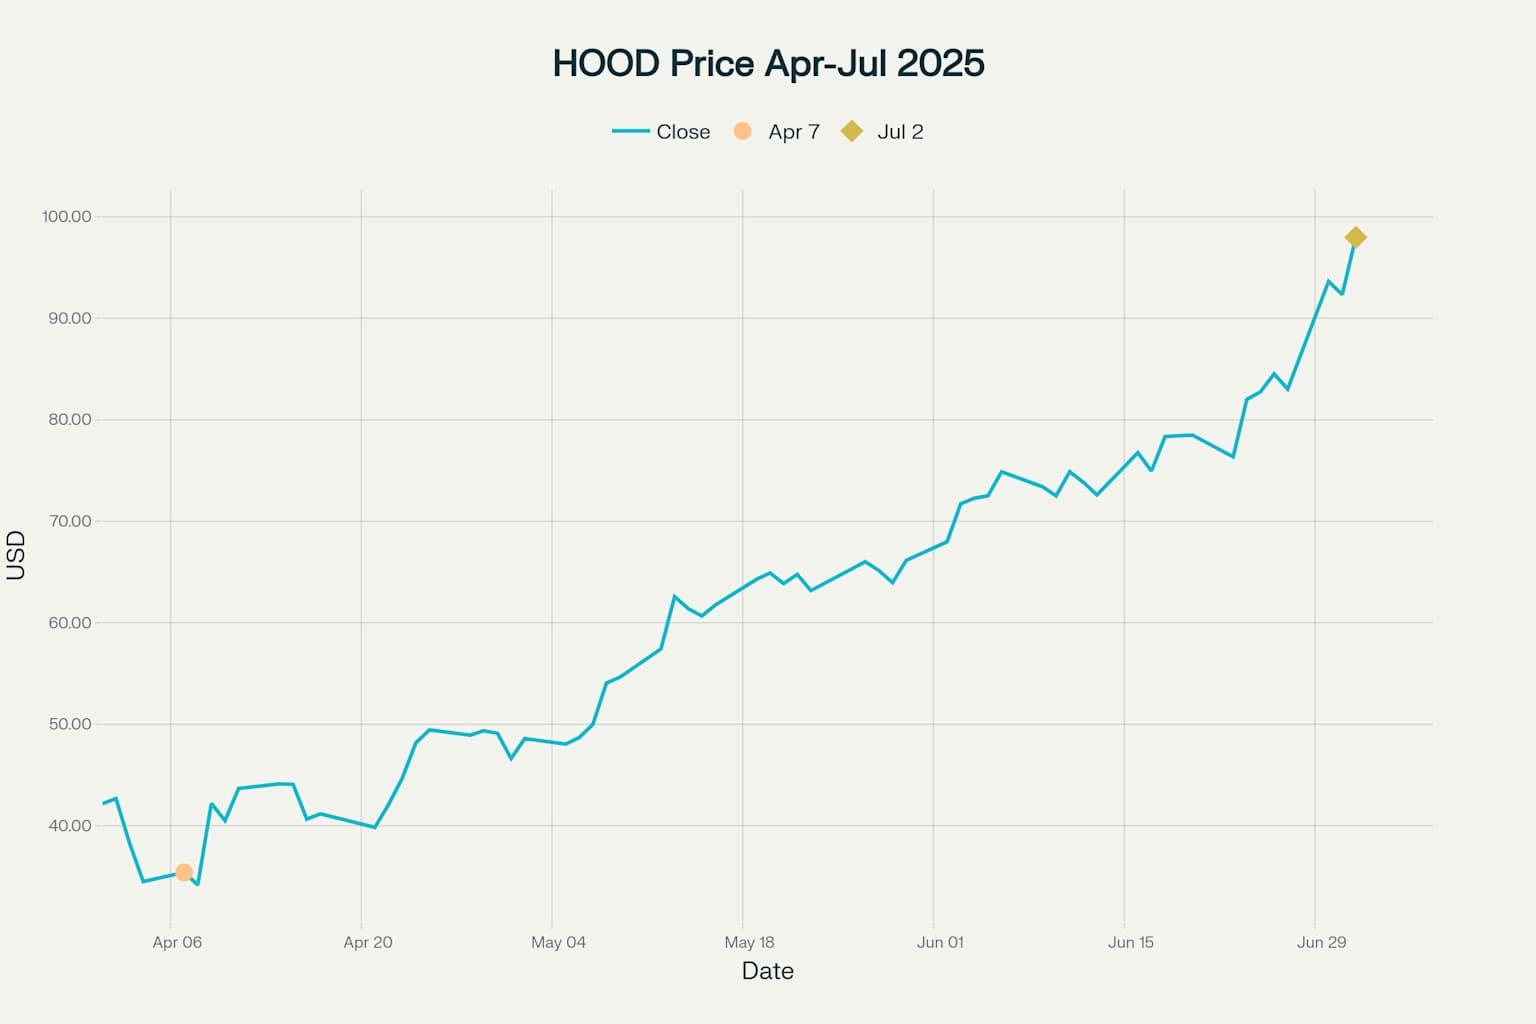
HOOD Stock Price Performance: April - July 2025
Understanding Robinhood: Business Model and Core Operations
What Robinhood Does
Robinhood Markets, Inc. is a pioneering financial technology company that has fundamentally democratized access to financial markets. Founded in 2013 by Vladimir Tenev and Baiju Bhatt, the company operates a commission-free digital trading platform that enables users to buy and sell stocks, exchange-traded funds (ETFs), options, cryptocurrencies, and other financial instruments through intuitive mobile and web applications.
The company's mission is to "democratize finance for all" by removing traditional barriers that have historically limited investment opportunities to wealthy individuals. With 25.8 million funded customers and $221 billion in assets under custody as of Q1 2025, Robinhood has established itself as a major force in retail investing.
Revenue Model and Business Operations
Robinhood's revenue structure is diversified across three primary segments:
Transaction-Based Revenues (63% of Q1 2025 revenues): The company generates income through payment for order flow (PFOF) arrangements, where market makers compensate Robinhood for routing customer orders to them for execution. This includes revenues from equity and options trading, as well as transaction rebates from cryptocurrency trading.
Net Interest Revenues (31% of Q1 2025 revenues): Robinhood earns interest from margin loans to customers, interest on customer cash balances through its Cash Sweep program, and securities lending activities.
Other Revenues (6% of Q1 2025 revenues): This includes subscription fees from Robinhood Gold premium memberships, which reached 3.2 million subscribers in Q1 2025, and other services.
The Catalyst: Q1 2025 Earnings Breakthrough
Record-Breaking Financial Performance
The foundation for HOOD's spectacular rally was laid with the company's outstanding Q1 2025 earnings announced on April 30, 2025. The results exceeded expectations across virtually every metric:
Revenue Growth: Total net revenues surged 50% year-over-year to $927 million, significantly beating analyst expectations of $920 million.
Profitability Explosion: Net income jumped 114% year-over-year to $336 million, while diluted earnings per share increased 106% to $0.37, compared to $0.18 in Q1 2024.
Cryptocurrency Revenue Surge: Perhaps most impressively, cryptocurrency trading revenue doubled to $252 million, representing a 100% year-over-year increase. This dramatic growth reflected renewed retail interest in digital assets and Robinhood's enhanced crypto capabilities.
Key Performance Metrics
The Q1 2025 results showcased robust growth across all business segments:
- Funded Customers: Reached 25.8 million, up 1.9 million year-over-year
- Total Platform Assets: Surged 70% year-over-year to $221 billion
- Net Deposits: Hit a record $18.0 billion for the quarter
- Robinhood Gold Subscribers: Grew 90% to 3.2 million
- Options Revenue: Increased 56% to $240 million
- Equities Revenue: Rose 44% to $56 million
Market Reaction and Analyst Response
The exceptional Q1 results triggered immediate positive market reaction. Analysts praised the company's ability to expand market share while maintaining disciplined expense management. The 50% year-over-year revenue growth combined with over 100% EPS growth demonstrated Robinhood's operating leverage and scalability.
Strategic Expansions and Major Acquisitions
Bitstamp Acquisition: A Global Crypto Play
One of the most significant catalysts for HOOD's rally was Robinhood's $200 million acquisition of Bitstamp, which closed on June 2, 2025. This strategic move marked a pivotal moment in Robinhood's transformation into a global cryptocurrency powerhouse.
Strategic Significance: Bitstamp, founded in 2011, is the world's longest-running active cryptocurrency exchange with over 50 active licenses and registrations globally. The acquisition brought approximately 500,000 funded retail customers and 5,000 institutional customers to Robinhood's ecosystem.
Financial Impact: Robinhood anticipates Bitstamp to be roughly Adjusted EBITDA neutral immediately following the close and EBITDA accretive within 12 months. The acquisition significantly accelerates Robinhood's international expansion, particularly in institutional crypto markets.
European Market Penetration
Robinhood's European expansion gained significant momentum throughout the period:
Regulatory Achievement: Lithuania's central bank issued Robinhood its first-ever crypto asset service license at the end of May 2025, authorizing comprehensive crypto services across the European Economic Area.
MiCA License: Robinhood obtained crucial Markets in Crypto-Assets Regulation (MiCA) licensing, enabling operations across 27 European countries.
Operational Launch: The company established its first European cryptocurrency trading hub in Lithuania, providing crypto asset custody, administration, and transfer services across the EEA.
Revolutionary Crypto and Blockchain Innovations
Tokenized Stock Trading: A Market First
Perhaps the most groundbreaking development was Robinhood's launch of tokenized U.S. stock and ETF trading for European customers in late June 2025. This innovation represented a fundamental shift in how traditional securities could be accessed globally.
Product Features: European customers gained access to over 200 U.S. stocks and ETFs in tokenized form, including major names like Apple, Microsoft, Nvidia, and the Vanguard S&P 500 ETF. These tokens offer 24/7 trading, zero commissions, and direct dividend payments.
Private Equity Access: In a market-first move, Robinhood introduced tokenized shares of private companies, starting with OpenAI and SpaceX, making previously inaccessible investments available to qualified European investors.
Robinhood Chain: Building the Future
Layer 2 Blockchain Development: Robinhood announced the development of its own Layer 2 blockchain based on Arbitrum technology. This proprietary blockchain is specifically optimized for tokenized real-world assets and designed to support 24/7 trading, self-custody, and cross-chain bridging.
Vision and Strategy: CEO Vlad Tenev described the initiative as laying "the groundwork for crypto to become the backbone of the global financial system". This positioning places Robinhood at the forefront of the real-world asset (RWA) tokenization trend, a market that crossed $24 billion in June 2025.
Enhanced Crypto Services
Perpetual Futures Trading: Robinhood introduced crypto perpetual futures in the EU, offering eligible customers access to derivatives with up to 3x leverage. This service, powered by Bitstamp's infrastructure, targets active traders seeking sophisticated trading tools.
Crypto Staking Return: The company reintroduced crypto staking for U.S. customers, starting with Ethereum and Solana. This feature had previously faced regulatory restrictions from the SEC but was successfully relaunched as part of Robinhood's expanding crypto suite.
Operational Excellence and Growth Metrics
May 2025 Operating Data: Sustained Momentum
Robinhood's May 2025 operating data, released in June, demonstrated the sustainability of its growth trajectory:
Asset Growth: Total Platform Assets reached $255 billion, representing an 89% year-over-year increase and 10% month-over-month growth.
Trading Volume Surge:
- Equity trading volumes: $180.5 billion (up 108% year-over-year)
- Options contracts traded: 179.8 million (up 36% year-over-year)
- Crypto trading volumes: $11.7 billion (up 65% year-over-year)
Margin and Lending Growth: Margin balances doubled year-over-year to $9.0 billion, while securities lending revenue increased 43% to $33 million.
Share Buyback Authorization Expansion
Demonstrating confidence in its financial strength and future prospects, Robinhood's board of directors increased the share repurchase authorization by $500 million to $1.5 billion in April 2025. As of March 31, 2025, the company had already executed $579 million in share repurchases under its program.
Market Sentiment and Institutional Recognition
S&P 500 Inclusion Speculation
A significant driver of investor enthusiasm was widespread speculation about potential S&P 500 inclusion. Bank of America analysts identified Robinhood as a "prime candidate" for index inclusion, noting the company's $66.1 billion market capitalization as of June 2025, well above the $20.5 billion minimum requirement.
While Robinhood was ultimately not included in the June quarterly rebalancing, the speculation itself drove significant trading volume and investor interest. The stock briefly declined following the announcement but quickly recovered as investors focused on the company's fundamental growth story.
Analyst Upgrades and Price Target Increases
The combination of strong fundamentals and innovative product launches attracted positive analyst attention throughout the period:
Price Target Increases: Ed Engel at Compass Point raised his price target from $64 to $96, betting on increased revenue from margin trading and tokenization opportunities.
Institutional Investment: Cathie Wood's ARK Investment purchased 319,600 shares of Robinhood, signaling strong institutional confidence in the company's long-term prospects.
Competitive Positioning and Market Share Gains
Trading Market Share Expansion
Robinhood continued to gain market share across all trading categories throughout 2024 and into 2025:
- Equity trading market share: Up 14% in 2023
- Options trading market share: Up 19% in 2023
- Record options volumes: Q1 2025 saw record-breaking options trading activity
Product Innovation Velocity
The company's accelerated product development distinguished it from competitors:
Robinhood Legend: A sophisticated desktop trading platform designed for active traders, featuring advanced charting and analytical tools.
Robinhood Gold Enhancements: The premium subscription service reached 3.2 million subscribers, offering 5% APY on uninvested cash and the highly anticipated Robinhood Gold Card credit card.
24-Hour Market Access: Robinhood's 24-hour equity trading capability provided a competitive advantage, allowing customers to trade hundreds of stocks and ETFs around the clock.
The Crypto Renaissance and Retail Revival
Cryptocurrency Market Recovery
The broader cryptocurrency market recovery in 2025 provided a significant tailwind for Robinhood's crypto-focused growth strategy. Bitcoin and Ethereum's strong performance throughout the year renewed retail investor interest in digital assets, directly benefiting Robinhood's crypto trading revenues.
Revenue Mix Shift: Cryptocurrency revenue's growth to $252 million in Q1 2025 represented nearly half of total transaction-based revenue, highlighting the strategic importance of Robinhood's crypto capabilities.
Regulatory Clarity and Compliance
Robinhood's proactive approach to regulatory compliance and its ability to navigate complex crypto regulations across multiple jurisdictions positioned the company advantageously as competitors faced regulatory challenges. The successful obtainment of MiCA licensing in Europe demonstrated the company's commitment to operating within established regulatory frameworks.
Looking Forward: Future Growth Catalysts
Technology Infrastructure and Scalability
Robinhood's investment in robust technology infrastructure has enabled the company to handle increased trading volumes while maintaining service quality. The development of proprietary blockchain technology positions the company to capitalize on the growing tokenization trend.
Global Expansion Opportunities
The successful European launch provides a template for further international expansion. With Bitstamp's global licensing infrastructure, Robinhood is well-positioned to enter additional markets and serve both retail and institutional customers worldwide.
Product Diversification Strategy
The company's evolution from a simple trading app to a comprehensive financial services platform creates multiple revenue streams and reduces dependence on any single business line. The introduction of banking services, investment advisory capabilities, and AI-powered tools (Robinhood Cortex) expands the total addressable market.
Tickeron: Smart AI Trading Tools for a New Era of Market Access
As platforms like Robinhood redefine how individuals access and participate in financial markets, tools like Tickeron are giving active traders a deeper edge. Tickeron uses advanced machine learning to analyze price action, identify trade opportunities, and forecast short-term market movements across equities, ETFs, crypto, and more.
For those navigating fast-moving, tech-driven markets, Tickeron provides algorithmic precision and real-time decision support to enhance strategy and timing.
Key features include:
- AI Agents (60min / 15min / 5min): Intra-day trade generators using machine learning to deliver tactical, time-framed trade ideas based on current market conditions.
- AI Pattern Search Engine that detects classic chart formations and breakout setups with clear price targets and probability scores.
- Trend Prediction Engine that forecasts potential entry and exit points minutes after market open using real-time data.
- Real-Time Signal Screener for scanning stocks, crypto, and ETFs with continuously updated buy/sell signals
In a landscape where retail access meets institutional-level complexity—like the one Robinhood is building—Tickeron offers a powerful companion for traders seeking clarity and speed in their decision-making.
Conclusion: A New Chapter for Robinhood
Robinhood's extraordinary 230% stock rally from April to July 2025 was not merely a speculative surge but rather a reflection of fundamental business transformation and strategic positioning. The company successfully executed on multiple fronts simultaneously: delivering record financial performance, expanding internationally, innovating in cryptocurrency and blockchain technology, and building a more diversified and resilient business model.
The confluence of exceptional Q1 2025 earnings results, the strategic Bitstamp acquisition, breakthrough innovations in tokenized assets, and successful European expansion created a perfect storm of positive catalysts that drove HOOD to all-time highs. As the company continues to execute on its vision of democratizing finance globally through technology innovation, the rally appears to represent not just a moment of momentum, but a fundamental revaluation of Robinhood's long-term growth potential and market position.
With $97.98 representing a new all-time high and the company trading at levels that reflect both current performance and future potential, Robinhood has firmly established itself as a leading force in the evolving landscape of digital financial services. The successful integration of traditional finance with cutting-edge blockchain technology positions the company to capture significant value as the global financial system continues its digital transformation.
Aroon Indicator for HOOD shows an upward move is likely
HOOD's Aroon Indicator triggered a bullish signal on July 14, 2026. Tickeron's A.I.dvisor detected that the AroonUp green line is above 70 while the AroonDown red line is below 30. When the up indicator moves above 70 and the down indicator remains below 30, it is a sign that the stock could be setting up for a bullish move. Traders may want to buy the stock or look to buy calls options. A.I.dvisor looked at 260 similar instances where the Aroon Indicator showed a similar pattern. In of the 260 cases, the stock moved higher in the days that followed. This puts the odds of a move higher at .

Technical Analysis (Indicators)
Bullish Trend Analysis
The Stochastic Oscillator is in the oversold zone. Keep an eye out for a move up in the foreseeable future.
Following a 3-day Advance, the price is estimated to grow further. Considering data from situations where HOOD advanced for three days, in of 314 cases, the price rose further within the following month. The odds of a continued upward trend are .
Bearish Trend Analysis
The 10-day RSI Indicator for HOOD moved out of overbought territory on July 07, 2026. This could be a bearish sign for the stock. Traders may want to consider selling the stock or buying put options. Tickeron's A.I.dvisor looked at 48 similar instances where the indicator moved out of overbought territory. In of the 48 cases, the stock moved lower in the following days. This puts the odds of a move lower at .
The Momentum Indicator moved below the 0 level on July 16, 2026. You may want to consider selling the stock, shorting the stock, or exploring put options on HOOD as a result. In of 71 cases where the Momentum Indicator fell below 0, the stock fell further within the subsequent month. The odds of a continued downward trend are .
The Moving Average Convergence Divergence Histogram (MACD) for HOOD turned negative on July 14, 2026. This could be a sign that the stock is set to turn lower in the coming weeks. Traders may want to sell the stock or buy put options. Tickeron's A.I.dvisor looked at 47 similar instances when the indicator turned negative. In of the 47 cases the stock turned lower in the days that followed. This puts the odds of success at .
Following a 3-day decline, the stock is projected to fall further. Considering past instances where HOOD declined for three days, the price rose further in of 62 cases within the following month. The odds of a continued downward trend are .
HOOD broke above its upper Bollinger Band on July 06, 2026. This could be a sign that the stock is set to drop as the stock moves back below the upper band and toward the middle band. You may want to consider selling the stock or exploring put options.
Fundamental Analysis (Ratings)
The Tickeron SMR rating for this company is (best 1 - 100 worst), indicating strong sales and a profitable business model. SMR (Sales, Margin, Return on Equity) rating is based on comparative analysis of weighted Sales, Income Margin and Return on Equity values compared against S&P 500 index constituents. The weighted SMR value is a proprietary formula developed by Tickeron and represents an overall profitability measure for a stock.
The Tickeron Price Growth Rating for this company is (best 1 - 100 worst), indicating steady price growth. HOOD’s price grows at a higher rate over the last 12 months as compared to S&P 500 index constituents.
The Tickeron PE Growth Rating for this company is (best 1 - 100 worst), pointing to worse than average earnings growth. The PE Growth rating is based on a comparative analysis of stock PE ratio increase over the last 12 months compared against S&P 500 index constituents.
The Tickeron Valuation Rating of (best 1 - 100 worst) indicates that the company is significantly overvalued in the industry. This rating compares market capitalization estimated by our proprietary formula with the current market capitalization. This rating is based on the following metrics, as compared to industry averages: P/B Ratio (9.560) is normal, around the industry mean (3.970). P/E Ratio (48.194) is within average values for comparable stocks, (48.548). Projected Growth (PEG Ratio) (2.689) is also within normal values, averaging (1.767). Dividend Yield (0.000) settles around the average of (0.034) among similar stocks. P/S Ratio (19.802) is also within normal values, averaging (29.923).
The Tickeron Profit vs. Risk Rating rating for this company is (best 1 - 100 worst), indicating that the returns do not compensate for the risks. HOOD’s unstable profits reported over time resulted in significant Drawdowns within these last five years. A stable profit reduces stock drawdown and volatility. The average Profit vs. Risk Rating rating for the industry is 85, placing this stock worse than average.
Notable companies
Industry description
Market Cap
High and low price notable news
Volume
Fundamental Analysis Ratings
The average fundamental analysis ratings, where 1 is best and 100 is worst, are as follows

Advertisement
General Information
Industry InvestmentBanksBrokers
Advertisement