Real-time pattern trading is a smart way to find entry and exit prices if you can scan thousands of stocks and ETFs within minutes. It is definitely impossible for humans. Artificial Intelligence (A.I.) not only discovers these patterns, but also checks if they worked out well in the past. Knowing the success rate in the past allows A.I. to establish the odds of success in the future.
The Symmetrical Triangle Top pattern forms when the price of a security fails to retest a high or low and ultimately forms two narrowing trend lines. The price is expected to move up or down past the triangle depending on which line is broken first. The price movement inside the triangle should fill the shape with some uniformity, without leaving large blank areas.
This pattern is commonly associated with directionless markets since the contraction (narrowing) of the market range signals that neither bulls nor bears are in control. However, there is a distinct possibility that market participants will either pour in or sell out, and the price can move up or down with big volumes (leading up to the breakout).
Once price breaks out from the top pattern boundary, day traders and swing traders should trade with an UP trend. Consider buying a security or a call option at the breakout price level. To identify an exit, compute the target price by adding the pattern height to the breakout point. The pattern height is the difference between the highest high and lowest low within the pattern.
To limit potential loss when price suddenly goes in the wrong direction, consider placing a stop order to sell at or below the breakout price.
Time frames No matter your trading strategy (day trading, swing, etc), we have patterns that will be ready to trade.
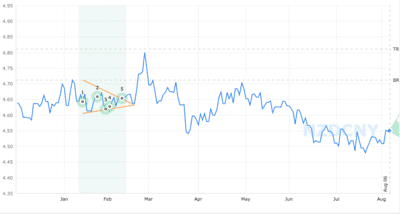
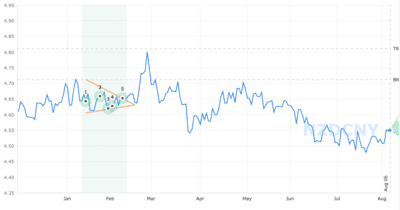
NZDCNY - New Zealand Dollar - China Yuan
| STATUS | Emerged |
|---|---|
| CURRENT CONFIDENCE | 64% |
| TARGET (EXIT) PRICE | 4.811670 CNY |
| BREAKOUT (ENTRY) PRICE | 4.712400 CNY |
| DISTANCE TO TARGET PRICE | 6.00% (2,721.6 pips) |
| EMERGED ON | Feb 10, closing price |
| WITH CONFIDENCE LEVEL | 0% |
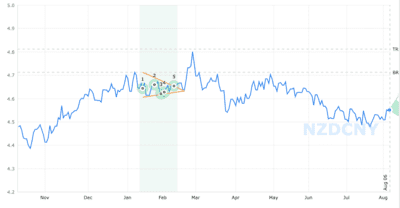
NZDCNY - New Zealand Dollar - China Yuan
| STATUS | Emerged |
|---|---|
| CURRENT CONFIDENCE | 73% |
| TARGET (EXIT) PRICE | 4.811670 CNY |
| BREAKOUT (ENTRY) PRICE | 4.712400 CNY |
| DISTANCE TO TARGET PRICE | 6.00% (2,721.6 pips) |
| EMERGED ON | Feb 10, closing price |
| WITH CONFIDENCE LEVEL | 0% |
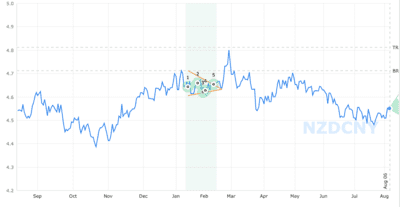
NZDCNY - New Zealand Dollar - China Yuan
| STATUS | Emerged |
|---|---|
| CURRENT CONFIDENCE | 62% |
| TARGET (EXIT) PRICE | 4.811670 CNY |
| BREAKOUT (ENTRY) PRICE | 4.712400 CNY |
| DISTANCE TO TARGET PRICE | 6.00% (2,721.6 pips) |
| EMERGED ON | Feb 10, closing price |
| WITH CONFIDENCE LEVEL | 0% |
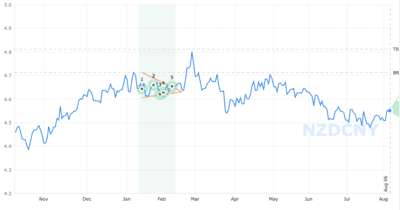
NZDCNY - New Zealand Dollar - China Yuan
| STATUS | Emerged |
|---|---|
| CURRENT CONFIDENCE | 55% |
| TARGET (EXIT) PRICE | 4.811670 CNY |
| BREAKOUT (ENTRY) PRICE | 4.712400 CNY |
| DISTANCE TO TARGET PRICE | 6.00% (2,721.6 pips) |
| EMERGED ON | Feb 09, closing price |
| WITH CONFIDENCE LEVEL | 0% |
NZDCNY - New Zealand Dollar - China Yuan
| STATUS | Emerged |
|---|---|
| CURRENT CONFIDENCE | 64% |
| TARGET (EXIT) PRICE | 4.811670 CNY |
| BREAKOUT (ENTRY) PRICE | 4.712400 CNY |
| DISTANCE TO TARGET PRICE | 6.00% (2,721.6 pips) |
| EMERGED ON | Feb 09, closing price |
| WITH CONFIDENCE LEVEL | 0% |