MENU

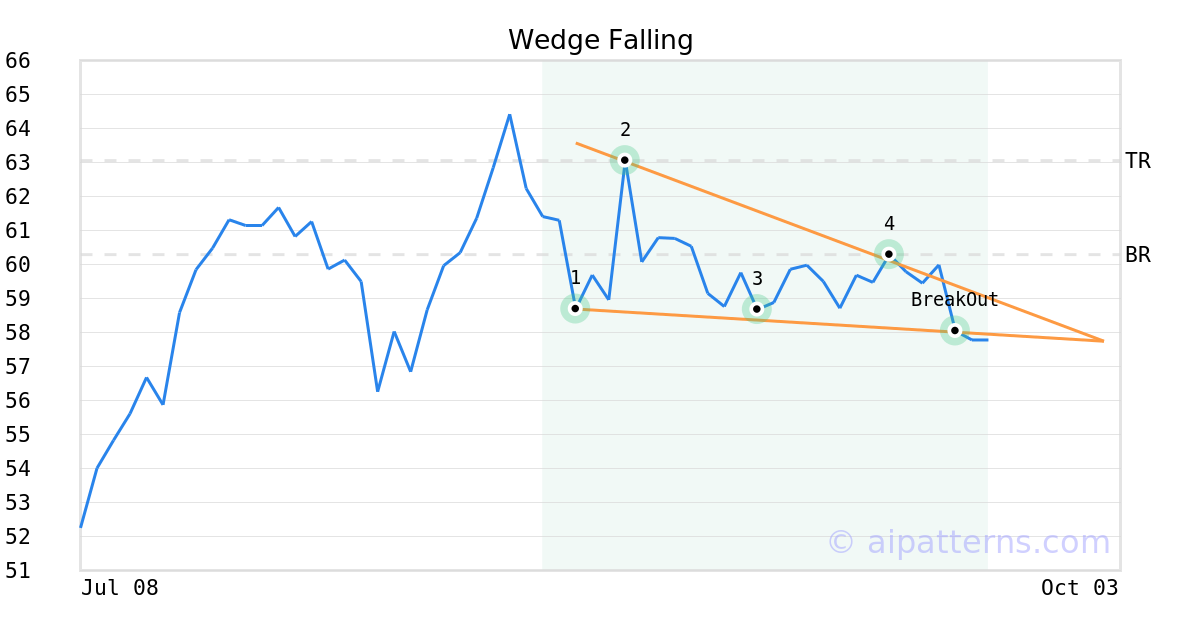
ARKD Stock Tickeron detected bullish ETF Pattern: Triple Bottoms ARKD on June 23, 2025, netting in a 9.34% gain over 1 week

A.I.dvisor
at Tickeron.com
Loading...
+9.34% Gain from a Successful pattern Triple Bottoms
ARKD - ARK 21Shares Digital Ass And Blc Str ETF
Tickeron
Ticker: ARKD
Company: ARK 21Shares Digital Ass And Blc Str ETF
Gain: +9.34%
Confirmed: 06/23/25
Succeeded: 06/24/25
Total length: 11 days
On June 13, 2025, A.I.dvisor detected a Triple Bottoms Pattern (Bullish) for ARK 21Shares Digital Ass And Blc Str ETF (ARKD, $46.62). On June 23, 2025, A.I.dvisor confirmed the Bullish pattern, setting a target price of $51.19. 1 day later, on June 24, 2025, ARKD reached the target price resulting in a for traders who took a long position in the stock.

Momentum Indicator for ARKD turns positive, indicating new upward trend

ARKD saw its Momentum Indicator move above the 0 level on June 18, 2025. This is an indication that the stock could be shifting in to a new upward move. Traders may want to consider buying the stock or buying call options. Tickeron's A.I.dvisor looked at 23 similar instances where the indicator turned positive. In of the 23 cases, the stock moved higher in the following days. The odds of a move higher are at .

Price Prediction Chart

Technical Analysis (Indicators)

Bullish Trend Analysis

The Moving Average Convergence Divergence (MACD) for ARKD just turned positive on June 25, 2025. Looking at past instances where ARKD's MACD turned positive, the stock continued to rise in of 14 cases over the following month. The odds of a continued upward trend are .

The 50-day moving average for ARKD moved above the 200-day moving average on June 18, 2025. This could be a long-term bullish signal for the stock as the stock shifts to an upward trend.

The Aroon Indicator entered an Uptrend today. In of 85 cases where ARKD Aroon's Indicator entered an Uptrend, the price rose further within the following month. The odds of a continued Uptrend are .

Bearish Trend Analysis

The 10-day RSI Indicator for ARKD moved out of overbought territory on June 27, 2025. This could be a bearish sign for the stock. Traders may want to consider selling the stock or buying put options. Tickeron's A.I.dvisor looked at 14 similar instances where the indicator moved out of overbought territory. In of the 14 cases, the stock moved lower in the following days. This puts the odds of a move lower at .

The Stochastic Oscillator demonstrated that the ticker has stayed in the overbought zone for 7 days. The longer the ticker stays in the overbought zone, the sooner a price pull-back is expected.

ARKD broke above its upper Bollinger Band on June 24, 2025. This could be a sign that the stock is set to drop as the stock moves back below the upper band and toward the middle band. You may want to consider selling the stock or exploring put options.

View a ticker or compare two or three
ARKD
Daily Signalchanged days ago
Gain/Loss if bought
Show more...
Interact to see
Advertisement
A.I.Advisor
published price charts
A.I. Advisor
published General Information

General Information

Category Digitalccurrency

Profile
Fundamentals
Details
Category
Digital Assets
Address
Alpha Architect ETF Trust213 Foxcroft Road, Broomall, PennsylvaniaBroomall
Phone
N/A
Web
www.valueshares.com