BCH.X Crypto Tickeron detected bullish Crypto Pattern: Three Rising Valleys on November 20, 2025


at Tickeron.com


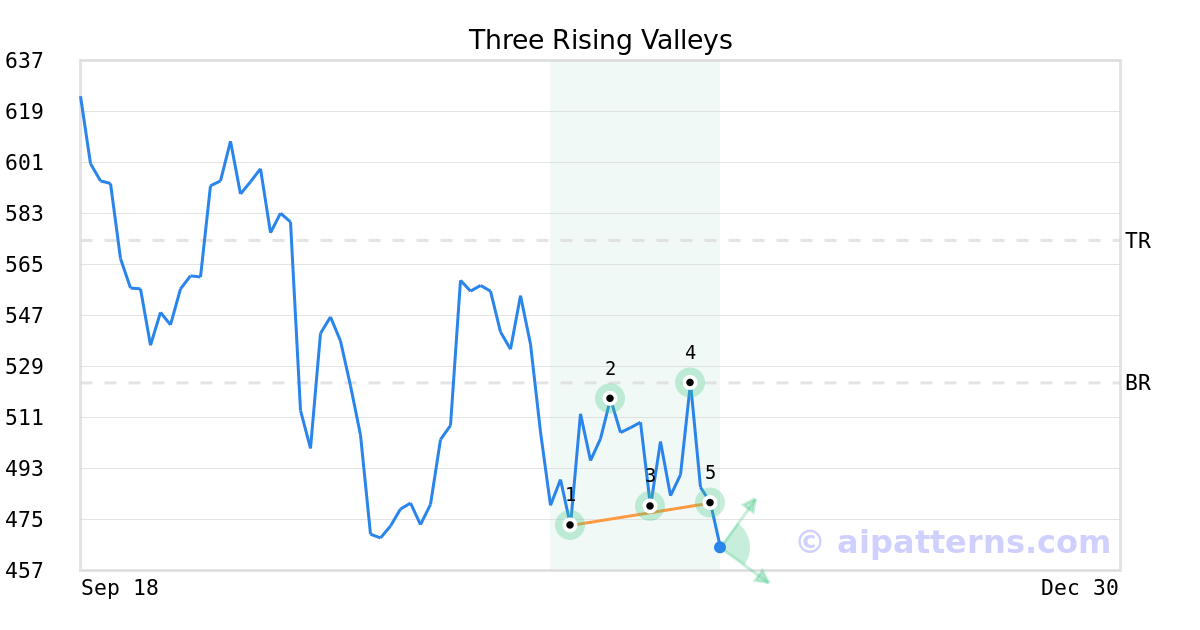
A.I.dvisor detected a bullish Three Rising Valleys pattern for BCH.X stock. This pattern was detected on November 20, 2025 . The odds of reaching the target price are 5.
The Three Rising Valleys pattern forms when three minor Lows (1, 3, 5) are arranged along an upward sloping trend line.
Consider buying a security or call option at the breakout price level. When trading, wait for the confirmation move, which is when the price rises above the breakout level.
BCH.X in upward trend: price rose above 50-day moving average on November 21, 2025
BCH.X moved above its 50-day moving average on November 21, 2025 date and that indicates a change from a downward trend to an upward trend. In of 77 similar past instances, the stock price increased further within the following month. The odds of a continued upward trend are .

Technical Analysis (Indicators)
Bullish Trend Analysis
The Momentum Indicator moved above the 0 level on November 21, 2025. You may want to consider a long position or call options on BCH.X as a result. In of 151 past instances where the momentum indicator moved above 0, the stock continued to climb. The odds of a continued upward trend are .
The Moving Average Convergence Divergence (MACD) for BCH.X just turned positive on November 21, 2025. Looking at past instances where BCH.X's MACD turned positive, the stock continued to rise in of 70 cases over the following month. The odds of a continued upward trend are .
The 10-day moving average for BCH.X crossed bullishly above the 50-day moving average on November 25, 2025. This indicates that the trend has shifted higher and could be considered a buy signal. In of 31 past instances when the 10-day crossed above the 50-day, the stock continued to move higher over the following month. The odds of a continued upward trend are .
Following a +1 3-day Advance, the price is estimated to grow further. Considering data from situations where BCH.X advanced for three days, in of 413 cases, the price rose further within the following month. The odds of a continued upward trend are .
Bearish Trend Analysis
The Stochastic Oscillator demonstrated that the ticker has stayed in the overbought zone for 6 days. The longer the ticker stays in the overbought zone, the sooner a price pull-back is expected.
The 50-day moving average for BCH.X moved below the 200-day moving average on November 26, 2025. This could be a long-term bearish signal for the stock as the stock shifts to an downward trend.
Following a 3-day decline, the stock is projected to fall further. Considering past instances where BCH.X declined for three days, the price rose further in of 62 cases within the following month. The odds of a continued downward trend are .
BCH.X broke above its upper Bollinger Band on November 21, 2025. This could be a sign that the stock is set to drop as the stock moves back below the upper band and toward the middle band. You may want to consider selling the stock or exploring put options.
The Aroon Indicator for BCH.X entered a downward trend on November 24, 2025. This could indicate a strong downward move is ahead for the stock. Traders may want to consider selling the stock or buying put options.