DIM Stock Tickeron detected bullish ETF Pattern: Cup-and-Handle on December 02, 2025


at Tickeron.com


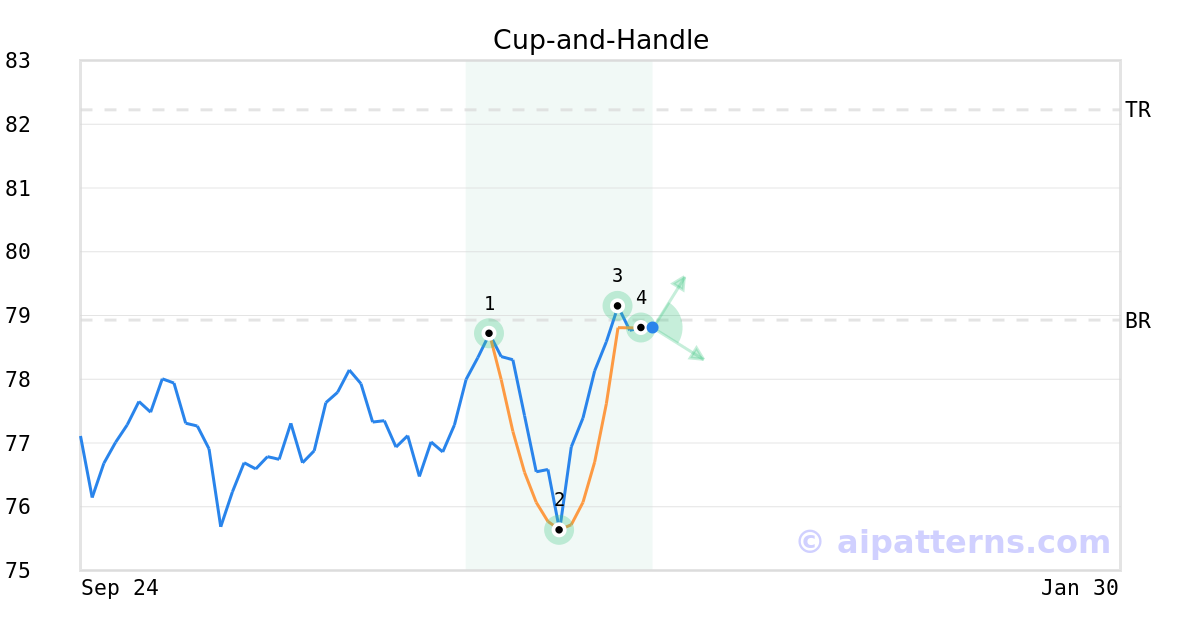
A.I.dvisor detected a bullish Cup-and-Handle pattern for DIM stock. This pattern was detected on December 02, 2025 . The odds of reaching the target price are 6.
The Cup-and-Handle (sometimes called Cup-and-Holder) pattern is formed when the price of a security initially declines and then rises to form a “U”-like rounded shape (1, 2, 3, also known as the Cup). Once it forms the right lip, it is characterized by short, relatively straight price decline (from 3 to 4) forming the handle.
Consider buying a security or call option at the upward breakout price/entry point. The confirmation move is when the security moves past the breakout price above the right cup lip.
DIM's MACD Histogram crosses above signal line
The Moving Average Convergence Divergence (MACD) for DIM turned positive on November 26, 2025. Looking at past instances where DIM's MACD turned positive, the stock continued to rise in of 43 cases over the following month. The odds of a continued upward trend are .

Technical Analysis (Indicators)
Bullish Trend Analysis
The Momentum Indicator moved above the 0 level on November 28, 2025. You may want to consider a long position or call options on DIM as a result. In of 79 past instances where the momentum indicator moved above 0, the stock continued to climb. The odds of a continued upward trend are .
DIM moved above its 50-day moving average on November 24, 2025 date and that indicates a change from a downward trend to an upward trend.
The 10-day moving average for DIM crossed bullishly above the 50-day moving average on October 28, 2025. This indicates that the trend has shifted higher and could be considered a buy signal. In of 17 past instances when the 10-day crossed above the 50-day, the stock continued to move higher over the following month. The odds of a continued upward trend are .
Following a 3-day Advance, the price is estimated to grow further. Considering data from situations where DIM advanced for three days, in of 348 cases, the price rose further within the following month. The odds of a continued upward trend are .
The Aroon Indicator entered an Uptrend today. In of 309 cases where DIM Aroon's Indicator entered an Uptrend, the price rose further within the following month. The odds of a continued Uptrend are .
Bearish Trend Analysis
The Stochastic Oscillator has been in the overbought zone for 2 days. Expect a price pull-back in the near future.
Following a 3-day decline, the stock is projected to fall further. Considering past instances where DIM declined for three days, the price rose further in of 62 cases within the following month. The odds of a continued downward trend are .
Advertisement
General Information
Category ForeignSmallMidValue