DVY Stock Tickeron detected bullish ETF Pattern: Broadening Wedge Descending DVY on November 24, 2025, netting in a 3.33% gain over 5 days


at Tickeron.com


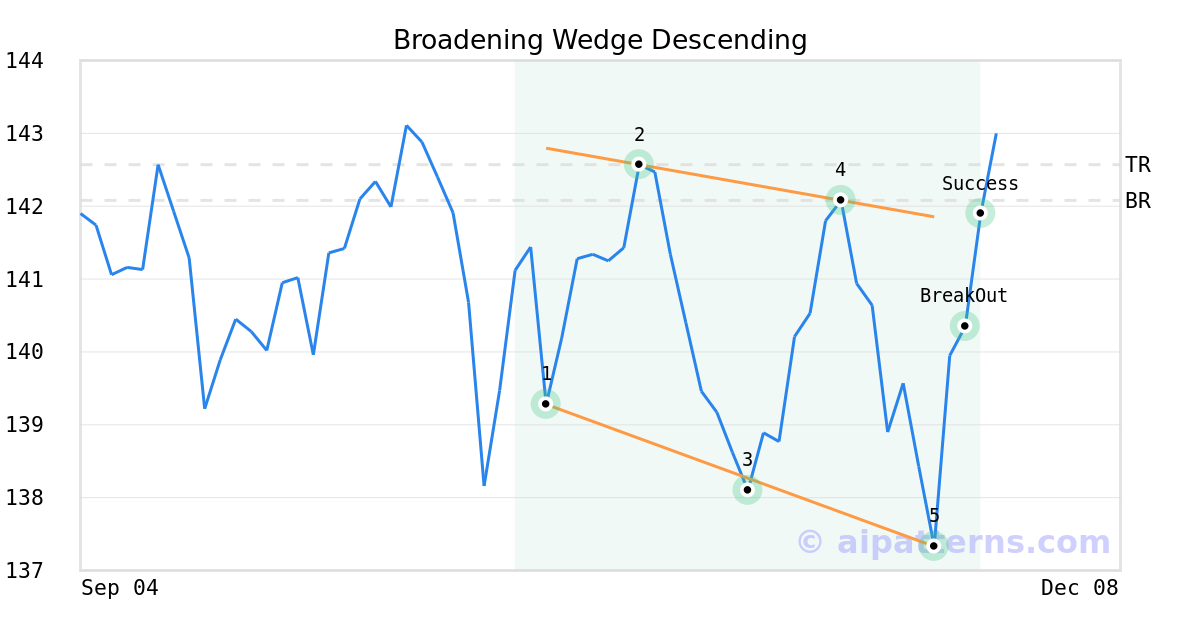
On November 20, 2025, A.I.dvisor detected a Broadening Wedge Descending Pattern (Bullish) for iShares Select Dividend ETF (DVY, $137.33). On November 24, 2025, A.I.dvisor confirmed the Bullish pattern, setting a target price of $142.57. 1 day later, on November 25, 2025, DVY reached the target price resulting in a for traders who took a long position in the stock.
Momentum Indicator for DVY turns positive, indicating new upward trend
DVY saw its Momentum Indicator move above the 0 level on November 25, 2025. This is an indication that the stock could be shifting in to a new upward move. Traders may want to consider buying the stock or buying call options. Tickeron's A.I.dvisor looked at 85 similar instances where the indicator turned positive. In of the 85 cases, the stock moved higher in the following days. The odds of a move higher are at .

Technical Analysis (Indicators)
Bullish Trend Analysis
The Moving Average Convergence Divergence (MACD) for DVY just turned positive on November 25, 2025. Looking at past instances where DVY's MACD turned positive, the stock continued to rise in of 42 cases over the following month. The odds of a continued upward trend are .
DVY moved above its 50-day moving average on November 25, 2025 date and that indicates a change from a downward trend to an upward trend.
Following a 3-day Advance, the price is estimated to grow further. Considering data from situations where DVY advanced for three days, in of 339 cases, the price rose further within the following month. The odds of a continued upward trend are .
Bearish Trend Analysis
The Stochastic Oscillator has been in the overbought zone for 1 day. Expect a price pull-back in the near future.
The 10-day moving average for DVY crossed bearishly below the 50-day moving average on November 04, 2025. This indicates that the trend has shifted lower and could be considered a sell signal. In of 18 past instances when the 10-day crossed below the 50-day, the stock continued to move higher over the following month. The odds of a continued downward trend are .
Following a 3-day decline, the stock is projected to fall further. Considering past instances where DVY declined for three days, the price rose further in of 62 cases within the following month. The odds of a continued downward trend are .
The Aroon Indicator for DVY entered a downward trend on November 11, 2025. This could indicate a strong downward move is ahead for the stock. Traders may want to consider selling the stock or buying put options.
Advertisement
General Information
Category MidCapValue