LMND Stock Tickeron detected bullish Stock Pattern: Cup-and-Handle on December 02, 2025


at Tickeron.com


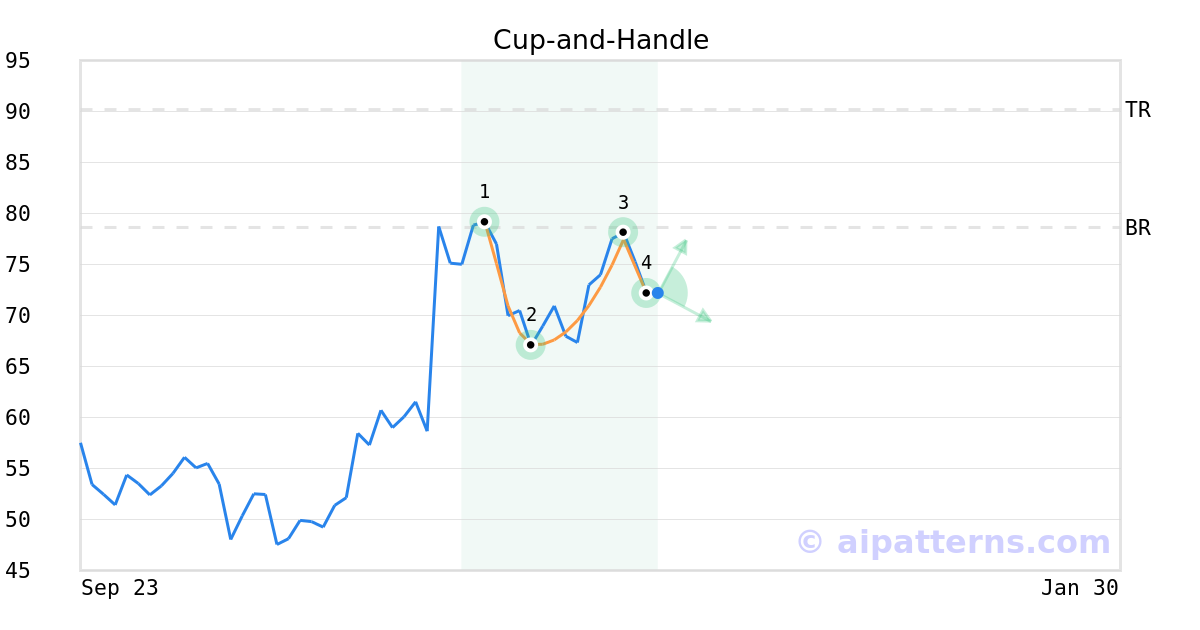
A.I.dvisor detected a bullish Cup-and-Handle pattern for LMND stock. This pattern was detected on December 02, 2025 . The odds of reaching the target price are 6.
The Cup-and-Handle (sometimes called Cup-and-Holder) pattern is formed when the price of a security initially declines and then rises to form a “U”-like rounded shape (1, 2, 3, also known as the Cup). Once it forms the right lip, it is characterized by short, relatively straight price decline (from 3 to 4) forming the handle.
Consider buying a security or call option at the upward breakout price/entry point. The confirmation move is when the security moves past the breakout price above the right cup lip.
Momentum Indicator for LMND turns positive, indicating new upward trend
LMND saw its Momentum Indicator move above the 0 level on November 26, 2025. This is an indication that the stock could be shifting in to a new upward move. Traders may want to consider buying the stock or buying call options. Tickeron's A.I.dvisor looked at 91 similar instances where the indicator turned positive. In of the 91 cases, the stock moved higher in the following days. The odds of a move higher are at .

Technical Analysis (Indicators)
Bullish Trend Analysis
LMND moved above its 50-day moving average on October 27, 2025 date and that indicates a change from a downward trend to an upward trend.
The 10-day moving average for LMND crossed bullishly above the 50-day moving average on October 30, 2025. This indicates that the trend has shifted higher and could be considered a buy signal. In of 15 past instances when the 10-day crossed above the 50-day, the stock continued to move higher over the following month. The odds of a continued upward trend are .
Following a 3-day Advance, the price is estimated to grow further. Considering data from situations where LMND advanced for three days, in of 269 cases, the price rose further within the following month. The odds of a continued upward trend are .
The Aroon Indicator entered an Uptrend today. In of 132 cases where LMND Aroon's Indicator entered an Uptrend, the price rose further within the following month. The odds of a continued Uptrend are .
Bearish Trend Analysis
The 10-day RSI Indicator for LMND moved out of overbought territory on November 13, 2025. This could be a bearish sign for the stock. Traders may want to consider selling the stock or buying put options. Tickeron's A.I.dvisor looked at 28 similar instances where the indicator moved out of overbought territory. In of the 28 cases, the stock moved lower in the following days. This puts the odds of a move lower at .
The Stochastic Oscillator has been in the overbought zone for 1 day. Expect a price pull-back in the near future.
The Moving Average Convergence Divergence Histogram (MACD) for LMND turned negative on December 01, 2025. This could be a sign that the stock is set to turn lower in the coming weeks. Traders may want to sell the stock or buy put options. Tickeron's A.I.dvisor looked at 46 similar instances when the indicator turned negative. In of the 46 cases the stock turned lower in the days that followed. This puts the odds of success at .
Following a 3-day decline, the stock is projected to fall further. Considering past instances where LMND declined for three days, the price rose further in of 62 cases within the following month. The odds of a continued downward trend are .
LMND broke above its upper Bollinger Band on November 05, 2025. This could be a sign that the stock is set to drop as the stock moves back below the upper band and toward the middle band. You may want to consider selling the stock or exploring put options.
Fundamental Analysis (Ratings)
The Tickeron Price Growth Rating for this company is (best 1 - 100 worst), indicating steady price growth. LMND’s price grows at a higher rate over the last 12 months as compared to S&P 500 index constituents.
The Tickeron Valuation Rating of (best 1 - 100 worst) indicates that the company is significantly overvalued in the industry. This rating compares market capitalization estimated by our proprietary formula with the current market capitalization. This rating is based on the following metrics, as compared to industry averages: LMND's P/B Ratio (10.449) is very high in comparison to the industry average of (2.308). P/E Ratio (0.000) is within average values for comparable stocks, (15.814). LMND's Projected Growth (PEG Ratio) (0.000) is slightly lower than the industry average of (3.514). LMND has a moderately low Dividend Yield (0.000) as compared to the industry average of (0.038). LMND's P/S Ratio (8.013) is very high in comparison to the industry average of (1.539).
The Tickeron PE Growth Rating for this company is (best 1 - 100 worst), pointing to worse than average earnings growth. The PE Growth rating is based on a comparative analysis of stock PE ratio increase over the last 12 months compared against S&P 500 index constituents.
The Tickeron SMR rating for this company is (best 1 - 100 worst), indicating weak sales and an unprofitable business model. SMR (Sales, Margin, Return on Equity) rating is based on comparative analysis of weighted Sales, Income Margin and Return on Equity values compared against S&P 500 index constituents. The weighted SMR value is a proprietary formula developed by Tickeron and represents an overall profitability measure for a stock.
The Tickeron Profit vs. Risk Rating rating for this company is (best 1 - 100 worst), indicating that the returns do not compensate for the risks. LMND’s unstable profits reported over time resulted in significant Drawdowns within these last five years. A stable profit reduces stock drawdown and volatility. The average Profit vs. Risk Rating rating for the industry is 46, placing this stock worse than average.
Advertisement
General Information
an insurance holding company, which engages in the provision of home and renters insurance services
Industry PropertyCasualtyInsurance