NVD Stock Tickeron detected bullish ETF Pattern: Broadening Wedge Descending NVD on November 20, 2025, netting in a 24.34% gain over 3 weeks


at Tickeron.com


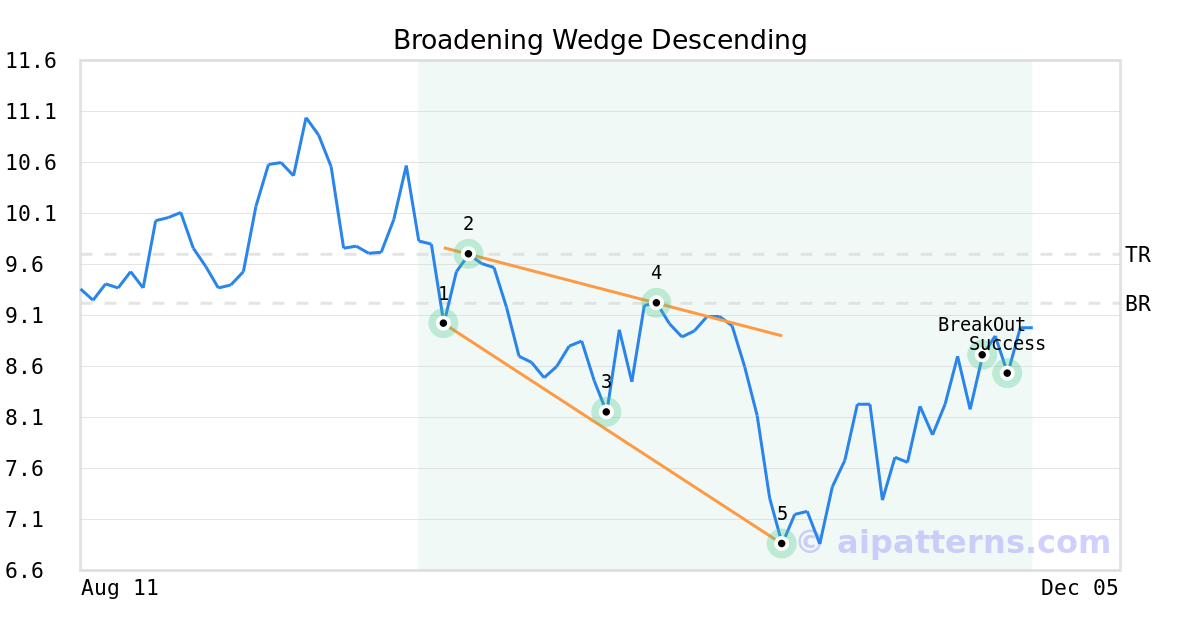
On October 29, 2025, A.I.dvisor detected a Broadening Wedge Descending Pattern (Bullish) for GraniteShares 2x Short NVDA Daily ETF (NVD, $6.86). On November 20, 2025, A.I.dvisor confirmed the Bullish pattern, setting a target price of $9.70. 4 days later, on November 24, 2025, NVD reached the target price resulting in a +2 for traders who took a long position in the stock.
NVD in upward trend: price rose above 50-day moving average on November 25, 2025
NVD moved above its 50-day moving average on November 25, 2025 date and that indicates a change from a downward trend to an upward trend. In of 17 similar past instances, the stock price increased further within the following month. The odds of a continued upward trend are .

Technical Analysis (Indicators)
Bullish Trend Analysis
The RSI Indicator points to a transition from a downward trend to an upward trend -- in cases where NVD's RSI Oscillator exited the oversold zone, of 18 resulted in an increase in price. Tickeron's analysis proposes that the odds of a continued upward trend are .
The Momentum Indicator moved above the 0 level on November 11, 2025. You may want to consider a long position or call options on NVD as a result. In of 29 past instances where the momentum indicator moved above 0, the stock continued to climb. The odds of a continued upward trend are .
The Moving Average Convergence Divergence (MACD) for NVD just turned positive on November 06, 2025. Looking at past instances where NVD's MACD turned positive, the stock continued to rise in of 15 cases over the following month. The odds of a continued upward trend are .
The 10-day moving average for NVD crossed bullishly above the 50-day moving average on November 28, 2025. This indicates that the trend has shifted higher and could be considered a buy signal. In of 6 past instances when the 10-day crossed above the 50-day, the stock continued to move higher over the following month. The odds of a continued upward trend are .
Following a 3-day Advance, the price is estimated to grow further. Considering data from situations where NVD advanced for three days, in of 96 cases, the price rose further within the following month. The odds of a continued upward trend are .
NVD may jump back above the lower band and head toward the middle band. Traders may consider buying the stock or exploring call options.
The Aroon Indicator entered an Uptrend today. In of 27 cases where NVD Aroon's Indicator entered an Uptrend, the price rose further within the following month. The odds of a continued Uptrend are .
Bearish Trend Analysis
The Stochastic Oscillator may be shifting from an upward trend to a downward trend. In of 21 cases where NVD's Stochastic Oscillator exited the overbought zone, the price fell further within the following month. The odds of a continued downward trend are .
Advertisement
General Information
Category Trading