PWRD Stock Tickeron detected bearish ETF Pattern: Broadening Wedge Ascending on October 24, 2025


at Tickeron.com


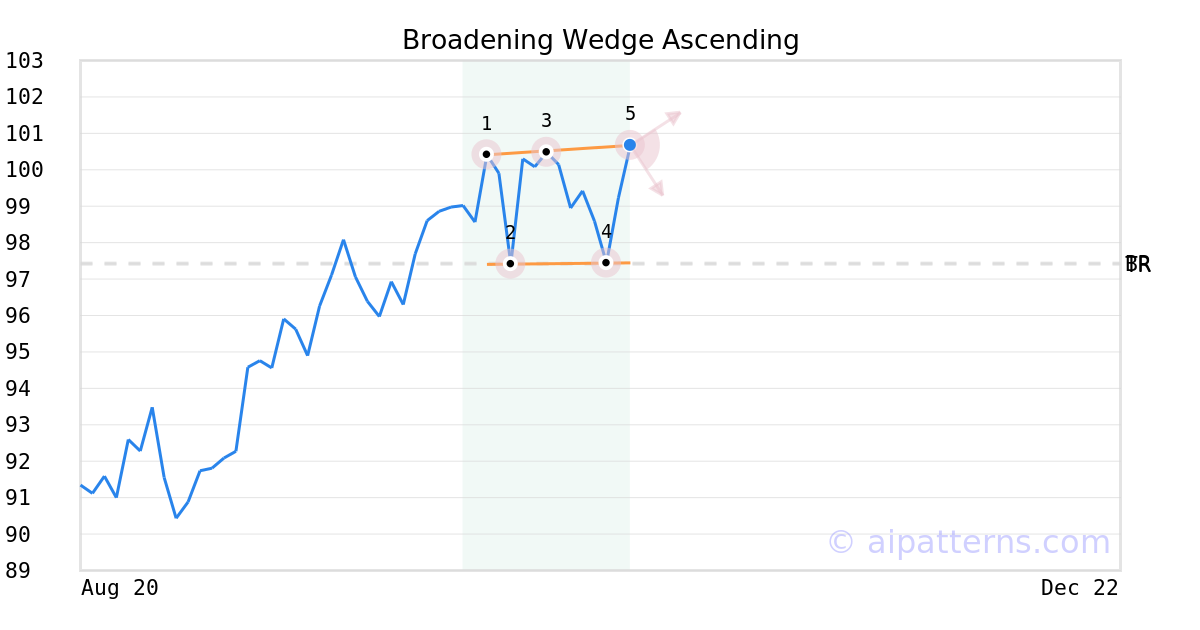
A.I.dvisor detected a bearish Broadening Wedge Ascending pattern for PWRD stock. This pattern was detected on October 24, 2025 . The odds of reaching the target price are 6.
The Broadening Wedge Ascending pattern forms when a security price progressively makes higher highs (1, 3, 5) and higher lows (2, 4), following two widening trend lines.
Consider selling the security short or buying a put option at the downward breakout price level, which is the last low that touches the bottom line (4).
Momentum Indicator for PWRD turns negative, indicating new downward trend
PWRD saw its Momentum Indicator move below the 0 level on November 06, 2025. This is an indication that the stock could be shifting in to a new downward move. Traders may want to consider selling the stock or exploring put options. Tickeron's A.I.dvisor looked at 58 similar instances where the indicator turned negative. In of the 58 cases, the stock moved further down in the following days. The odds of a decline are at .

Technical Analysis (Indicators)
Bearish Trend Analysis
The Moving Average Convergence Divergence Histogram (MACD) for PWRD turned negative on November 04, 2025. This could be a sign that the stock is set to turn lower in the coming weeks. Traders may want to sell the stock or buy put options. Tickeron's A.I.dvisor looked at 33 similar instances when the indicator turned negative. In of the 33 cases the stock turned lower in the days that followed. This puts the odds of success at .
PWRD moved below its 50-day moving average on November 13, 2025 date and that indicates a change from an upward trend to a downward trend.
The 10-day moving average for PWRD crossed bearishly below the 50-day moving average on November 18, 2025. This indicates that the trend has shifted lower and could be considered a sell signal. In of 14 past instances when the 10-day crossed below the 50-day, the stock continued to move higher over the following month. The odds of a continued downward trend are .
Following a 3-day decline, the stock is projected to fall further. Considering past instances where PWRD declined for three days, the price rose further in of 62 cases within the following month. The odds of a continued downward trend are .
Bullish Trend Analysis
The Stochastic Oscillator shows that the ticker has stayed in the oversold zone for 3 days. The price of this ticker is presumed to bounce back soon, since the longer the ticker stays in the oversold zone, the more promptly an upward trend is expected.
Following a 3-day Advance, the price is estimated to grow further. Considering data from situations where PWRD advanced for three days, in of 278 cases, the price rose further within the following month. The odds of a continued upward trend are .
PWRD may jump back above the lower band and head toward the middle band. Traders may consider buying the stock or exploring call options.
The Aroon Indicator entered an Uptrend today. In of 298 cases where PWRD Aroon's Indicator entered an Uptrend, the price rose further within the following month. The odds of a continued Uptrend are .
Advertisement