RBC Stock Tickeron detected bullish Stock Pattern: Triangle Descending RBC on October 23, 2025, netting in a 18.48% gain over 1 month


at Tickeron.com


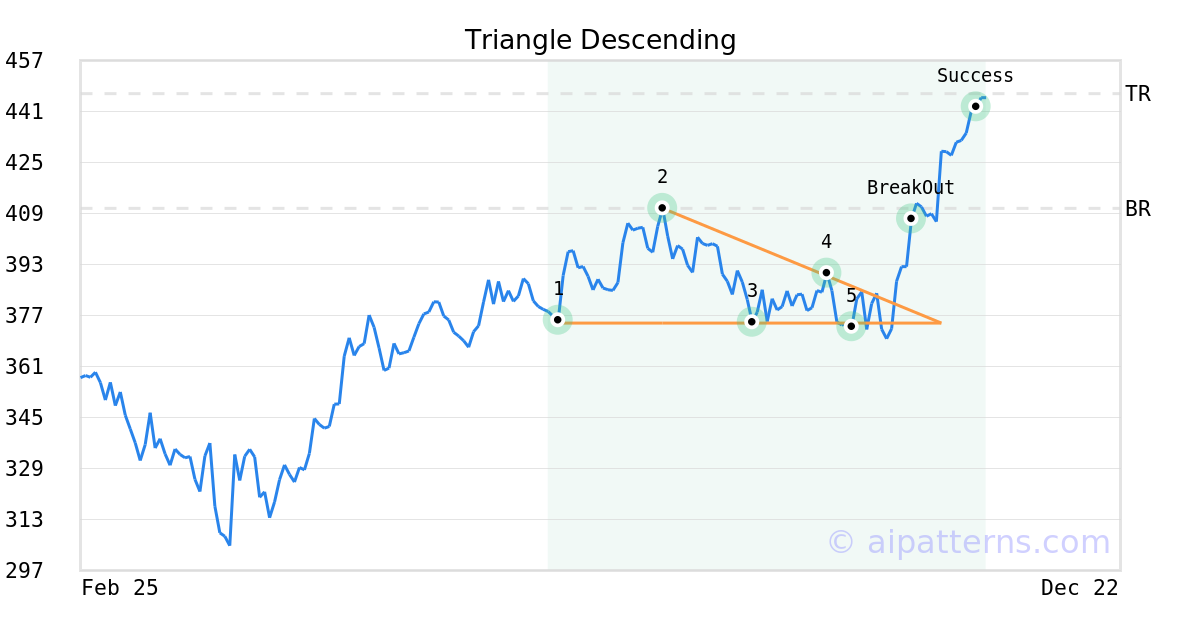
On October 07, 2025, A.I.dvisor detected a Triangle Descending Pattern (Bullish) for RBC Bearings (RBC, $373.47). On October 23, 2025, A.I.dvisor confirmed the Bullish pattern, setting a target price of $446.60. 19 days later, on November 11, 2025, RBC reached the target price resulting in a +1 for traders who took a long position in the stock.
RBC sees its Stochastic Oscillator ascending out of oversold territory
On November 24, 2025, the Stochastic Oscillator for RBC moved out of oversold territory and this could be a bullish sign for the stock. Traders may want to buy the stock or buy call options. Tickeron's A.I.dvisor looked at 64 instances where the indicator left the oversold zone. In of the 64 cases the stock moved higher in the following days. This puts the odds of a move higher at over .

Technical Analysis (Indicators)
Bullish Trend Analysis
The 10-day moving average for RBC crossed bullishly above the 50-day moving average on October 24, 2025. This indicates that the trend has shifted higher and could be considered a buy signal. In of 18 past instances when the 10-day crossed above the 50-day, the stock continued to move higher over the following month. The odds of a continued upward trend are .
Following a 3-day Advance, the price is estimated to grow further. Considering data from situations where RBC advanced for three days, in of 312 cases, the price rose further within the following month. The odds of a continued upward trend are .
The Aroon Indicator entered an Uptrend today. In of 231 cases where RBC Aroon's Indicator entered an Uptrend, the price rose further within the following month. The odds of a continued Uptrend are .
Bearish Trend Analysis
The 10-day RSI Indicator for RBC moved out of overbought territory on November 13, 2025. This could be a bearish sign for the stock. Traders may want to consider selling the stock or buying put options. Tickeron's A.I.dvisor looked at 32 similar instances where the indicator moved out of overbought territory. In of the 32 cases, the stock moved lower in the following days. This puts the odds of a move lower at .
The Momentum Indicator moved below the 0 level on November 26, 2025. You may want to consider selling the stock, shorting the stock, or exploring put options on RBC as a result. In of 92 cases where the Momentum Indicator fell below 0, the stock fell further within the subsequent month. The odds of a continued downward trend are .
The Moving Average Convergence Divergence Histogram (MACD) for RBC turned negative on November 17, 2025. This could be a sign that the stock is set to turn lower in the coming weeks. Traders may want to sell the stock or buy put options. Tickeron's A.I.dvisor looked at 49 similar instances when the indicator turned negative. In of the 49 cases the stock turned lower in the days that followed. This puts the odds of success at .
Following a 3-day decline, the stock is projected to fall further. Considering past instances where RBC declined for three days, the price rose further in of 62 cases within the following month. The odds of a continued downward trend are .
RBC broke above its upper Bollinger Band on October 23, 2025. This could be a sign that the stock is set to drop as the stock moves back below the upper band and toward the middle band. You may want to consider selling the stock or exploring put options.
Fundamental Analysis (Ratings)
The Tickeron Profit vs. Risk Rating rating for this company is (best 1 - 100 worst), indicating low risk on high returns. The average Profit vs. Risk Rating rating for the industry is 81, placing this stock better than average.
The Tickeron PE Growth Rating for this company is (best 1 - 100 worst), pointing to outstanding earnings growth. The PE Growth rating is based on a comparative analysis of stock PE ratio increase over the last 12 months compared against S&P 500 index constituents.
The Tickeron Price Growth Rating for this company is (best 1 - 100 worst), indicating steady price growth. RBC’s price grows at a higher rate over the last 12 months as compared to S&P 500 index constituents.
The Tickeron SMR rating for this company is (best 1 - 100 worst), indicating weak sales and an unprofitable business model. SMR (Sales, Margin, Return on Equity) rating is based on comparative analysis of weighted Sales, Income Margin and Return on Equity values compared against S&P 500 index constituents. The weighted SMR value is a proprietary formula developed by Tickeron and represents an overall profitability measure for a stock.
The Tickeron Valuation Rating of (best 1 - 100 worst) indicates that the company is slightly overvalued in the industry. This rating compares market capitalization estimated by our proprietary formula with the current market capitalization. This rating is based on the following metrics, as compared to industry averages: RBC's P/B Ratio (4.398) is slightly higher than the industry average of (2.168). RBC's P/E Ratio (53.928) is considerably higher than the industry average of (22.757). RBC's Projected Growth (PEG Ratio) (0.000) is slightly lower than the industry average of (3.793). RBC's Dividend Yield (0.000) is considerably lower than the industry average of (0.027). RBC's P/S Ratio (8.097) is very high in comparison to the industry average of (1.526).
Advertisement
General Information
Industry ToolsHardware