SDRL Stock Tickeron detected bullish Stock Pattern: Triangle Symmetrical Bottom on November 04, 2025


at Tickeron.com


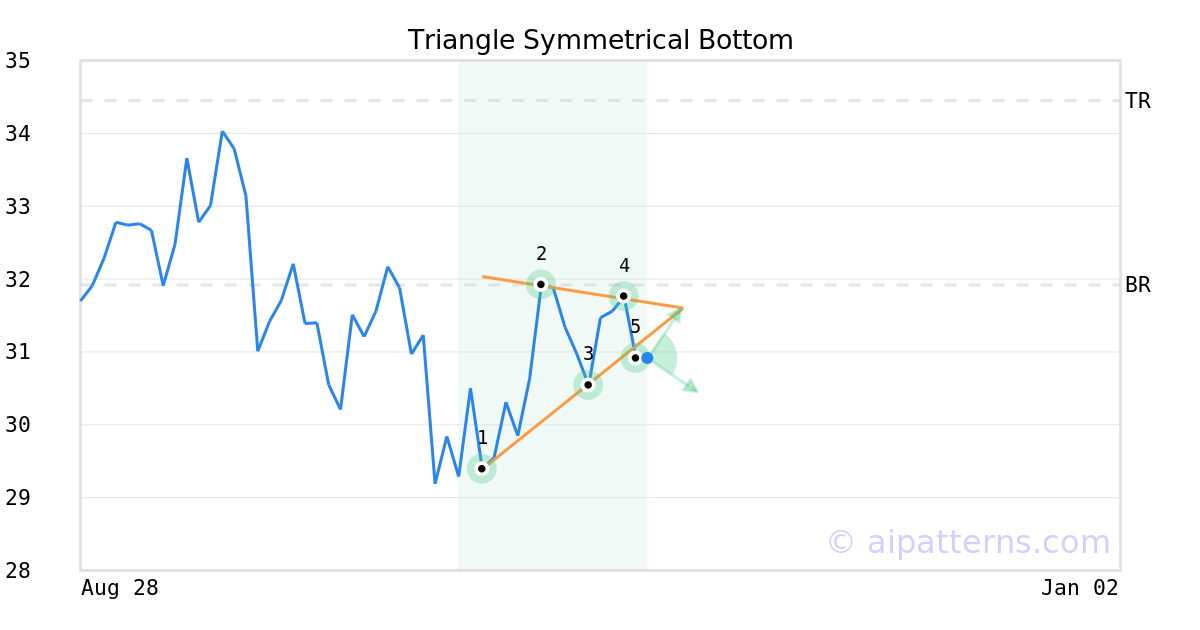
A.I.dvisor detected a bullish Triangle Symmetrical Bottom pattern for SDRL stock. This pattern was detected on November 04, 2025 . The odds of reaching the target price are .
The Symmetrical Triangle Bottom pattern forms when the price of a security fails to retest a high or a low and ultimately forms two narrowing trend lines. As the support and resistance levels consolidate, they form a triangle.
Consider buying a security or call option at the breakout price level. When trading, wait for the confirmation move, which is when the price rises above the breakout level.
SDRL's MACD Histogram just turned positive
The Moving Average Convergence Divergence (MACD) for SDRL turned positive on November 17, 2025. Looking at past instances where SDRL's MACD turned positive, the stock continued to rise in of 31 cases over the following month. The odds of a continued upward trend are .

Technical Analysis (Indicators)
Bullish Trend Analysis
The Momentum Indicator moved above the 0 level on November 18, 2025. You may want to consider a long position or call options on SDRL as a result. In of 54 past instances where the momentum indicator moved above 0, the stock continued to climb. The odds of a continued upward trend are .
Following a 3-day Advance, the price is estimated to grow further. Considering data from situations where SDRL advanced for three days, in of 204 cases, the price rose further within the following month. The odds of a continued upward trend are .
SDRL may jump back above the lower band and head toward the middle band. Traders may consider buying the stock or exploring call options.
Bearish Trend Analysis
The Stochastic Oscillator may be shifting from an upward trend to a downward trend. In of 38 cases where SDRL's Stochastic Oscillator exited the overbought zone, the price fell further within the following month. The odds of a continued downward trend are .
SDRL moved below its 50-day moving average on November 20, 2025 date and that indicates a change from an upward trend to a downward trend.
Following a 3-day decline, the stock is projected to fall further. Considering past instances where SDRL declined for three days, the price rose further in of 62 cases within the following month. The odds of a continued downward trend are .
The Aroon Indicator for SDRL entered a downward trend on October 28, 2025. This could indicate a strong downward move is ahead for the stock. Traders may want to consider selling the stock or buying put options.
Fundamental Analysis (Ratings)
The Tickeron PE Growth Rating for this company is (best 1 - 100 worst), pointing to outstanding earnings growth. The PE Growth rating is based on a comparative analysis of stock PE ratio increase over the last 12 months compared against S&P 500 index constituents.
The Tickeron Price Growth Rating for this company is (best 1 - 100 worst), indicating steady price growth. SDRL’s price grows at a higher rate over the last 12 months as compared to S&P 500 index constituents.
The Tickeron Profit vs. Risk Rating rating for this company is (best 1 - 100 worst), indicating well-balanced risk and returns. The average Profit vs. Risk Rating rating for the industry is 76, placing this stock slightly better than average.
The Tickeron SMR rating for this company is (best 1 - 100 worst), indicating weak sales and an unprofitable business model. SMR (Sales, Margin, Return on Equity) rating is based on comparative analysis of weighted Sales, Income Margin and Return on Equity values compared against S&P 500 index constituents. The weighted SMR value is a proprietary formula developed by Tickeron and represents an overall profitability measure for a stock.
The Tickeron Valuation Rating of (best 1 - 100 worst) indicates that the company is significantly overvalued in the industry. This rating compares market capitalization estimated by our proprietary formula with the current market capitalization. This rating is based on the following metrics, as compared to industry averages: P/B Ratio (0.656) is normal, around the industry mean (0.841). SDRL's P/E Ratio (64.064) is considerably higher than the industry average of (15.891). Projected Growth (PEG Ratio) (0.000) is also within normal values, averaging (3.755). SDRL has a moderately low Dividend Yield (0.000) as compared to the industry average of (0.062). P/S Ratio (1.435) is also within normal values, averaging (0.760).
Advertisement
General Information
an offshore drilling contractor providing offshore drilling services to the oil and gas industry.
Industry ContractDrilling