VEEV Stock Tickeron detected bearish Stock Pattern: Cup-and-Handle Inverse on October 31, 2025


at Tickeron.com


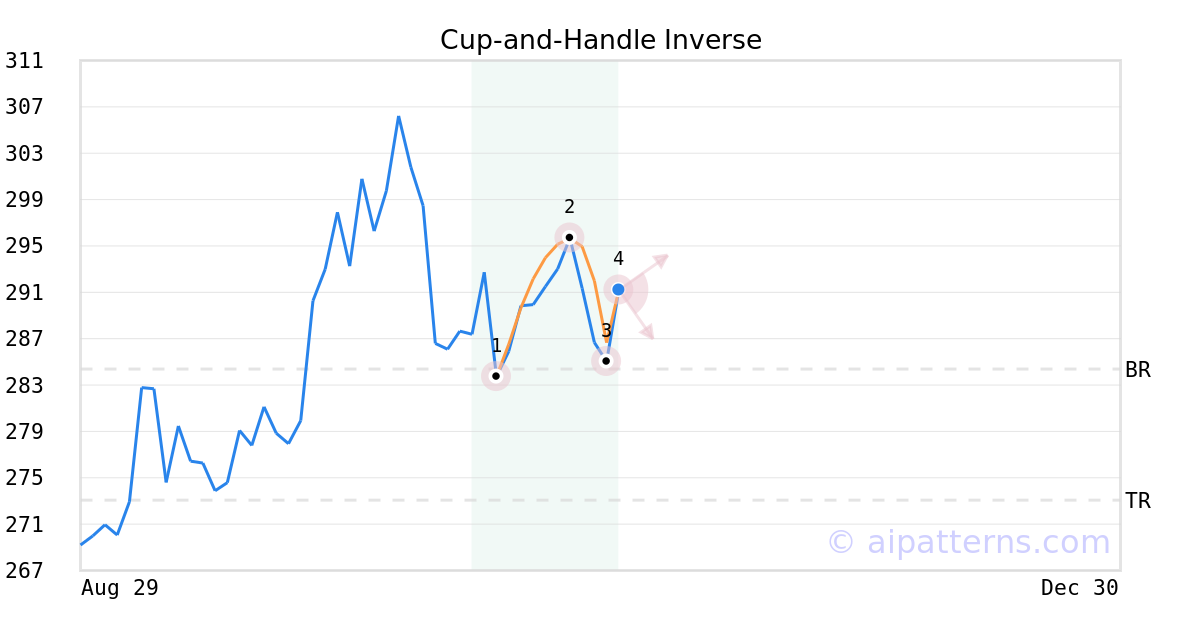
A.I.dvisor detected a bearish Cup-and-Handle Inverse pattern for VEEV stock. This pattern was detected on October 31, 2025 . The odds of reaching the target price are 6.
The Inverted Cup-and-Handle (sometimes called Inverted Cup-and-Holder) pattern forms when prices rise then decline to create an upside-down “U”like shape (1, 2, 3, also known as the Cup), followed by a shorter relatively straight price increase that bounces from the right lip (from 3 to 4, creating the Handle).
Consider selling the security short or buying a put option at the downward breakout level. The confirmation move is the breakout of the price below the right cup lip.
VEEV in downward trend: price dove below 50-day moving average on November 17, 2025
VEEV moved below its 50-day moving average on November 17, 2025 date and that indicates a change from an upward trend to a downward trend. In of 44 similar past instances, the stock price decreased further within the following month. The odds of a continued downward trend are .

Technical Analysis (Indicators)
Bearish Trend Analysis
The Momentum Indicator moved below the 0 level on November 17, 2025. You may want to consider selling the stock, shorting the stock, or exploring put options on VEEV as a result. In of 81 cases where the Momentum Indicator fell below 0, the stock fell further within the subsequent month. The odds of a continued downward trend are .
The Moving Average Convergence Divergence Histogram (MACD) for VEEV turned negative on November 14, 2025. This could be a sign that the stock is set to turn lower in the coming weeks. Traders may want to sell the stock or buy put options. Tickeron's A.I.dvisor looked at 50 similar instances when the indicator turned negative. In of the 50 cases the stock turned lower in the days that followed. This puts the odds of success at .
Following a 3-day decline, the stock is projected to fall further. Considering past instances where VEEV declined for three days, the price rose further in of 62 cases within the following month. The odds of a continued downward trend are .
Bullish Trend Analysis
The RSI Indicator entered the oversold zone -- be on the watch for VEEV's price rising or consolidating in the future. That's also the time to consider buying the stock or exploring call options.
The Stochastic Oscillator demonstrated that the ticker has stayed in the oversold zone for 1 day, which means it's wise to expect a price bounce in the near future.
Following a 3-day Advance, the price is estimated to grow further. Considering data from situations where VEEV advanced for three days, in of 275 cases, the price rose further within the following month. The odds of a continued upward trend are .
VEEV may jump back above the lower band and head toward the middle band. Traders may consider buying the stock or exploring call options.
The Aroon Indicator entered an Uptrend today. In of 237 cases where VEEV Aroon's Indicator entered an Uptrend, the price rose further within the following month. The odds of a continued Uptrend are .
Fundamental Analysis (Ratings)
The Tickeron PE Growth Rating for this company is (best 1 - 100 worst), pointing to consistent earnings growth. The PE Growth rating is based on a comparative analysis of stock PE ratio increase over the last 12 months compared against S&P 500 index constituents.
The Tickeron Price Growth Rating for this company is (best 1 - 100 worst), indicating steady price growth. VEEV’s price grows at a higher rate over the last 12 months as compared to S&P 500 index constituents.
The Tickeron SMR rating for this company is (best 1 - 100 worst), indicating strong sales and a profitable business model. SMR (Sales, Margin, Return on Equity) rating is based on comparative analysis of weighted Sales, Income Margin and Return on Equity values compared against S&P 500 index constituents. The weighted SMR value is a proprietary formula developed by Tickeron and represents an overall profitability measure for a stock.
The Tickeron Valuation Rating of (best 1 - 100 worst) indicates that the company is slightly overvalued in the industry. This rating compares market capitalization estimated by our proprietary formula with the current market capitalization. This rating is based on the following metrics, as compared to industry averages: P/B Ratio (6.739) is normal, around the industry mean (21.335). P/E Ratio (56.173) is within average values for comparable stocks, (105.249). Projected Growth (PEG Ratio) (1.259) is also within normal values, averaging (2.395). Dividend Yield (0.000) settles around the average of (0.028) among similar stocks. P/S Ratio (15.314) is also within normal values, averaging (67.320).
The Tickeron Profit vs. Risk Rating rating for this company is (best 1 - 100 worst), indicating that the returns do not compensate for the risks. VEEV’s unstable profits reported over time resulted in significant Drawdowns within these last five years. A stable profit reduces stock drawdown and volatility. The average Profit vs. Risk Rating rating for the industry is 96, placing this stock worse than average.
Advertisement
General Information
a provider of industry-specific, cloud-based software solutions for the life sciences industry
Industry ServicestotheHealthIndustry