WPP Stock Tickeron detected bullish Stock Pattern: Three Rising Valleys on December 01, 2025


at Tickeron.com


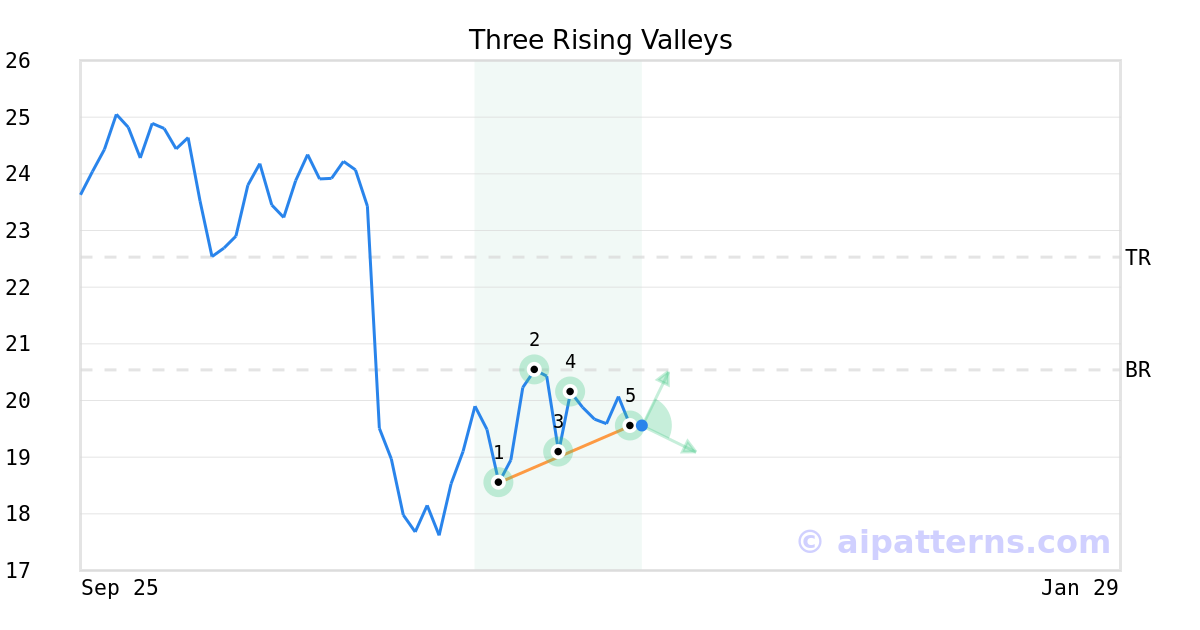
A.I.dvisor detected a bullish Three Rising Valleys pattern for WPP stock. This pattern was detected on December 01, 2025 . The odds of reaching the target price are 7.
The Three Rising Valleys pattern forms when three minor Lows (1, 3, 5) are arranged along an upward sloping trend line.
Consider buying a security or call option at the breakout price level. When trading, wait for the confirmation move, which is when the price rises above the breakout level.
Momentum Indicator for WPP turns positive, indicating new upward trend
WPP saw its Momentum Indicator move above the 0 level on November 26, 2025. This is an indication that the stock could be shifting in to a new upward move. Traders may want to consider buying the stock or buying call options. Tickeron's A.I.dvisor looked at 79 similar instances where the indicator turned positive. In of the 79 cases, the stock moved higher in the following days. The odds of a move higher are at .

Technical Analysis (Indicators)
Bullish Trend Analysis
The RSI Indicator points to a transition from a downward trend to an upward trend -- in cases where WPP's RSI Oscillator exited the oversold zone, of 33 resulted in an increase in price. Tickeron's analysis proposes that the odds of a continued upward trend are .
The Moving Average Convergence Divergence (MACD) for WPP just turned positive on November 17, 2025. Looking at past instances where WPP's MACD turned positive, the stock continued to rise in of 47 cases over the following month. The odds of a continued upward trend are .
Following a 3-day Advance, the price is estimated to grow further. Considering data from situations where WPP advanced for three days, in of 308 cases, the price rose further within the following month. The odds of a continued upward trend are .
WPP may jump back above the lower band and head toward the middle band. Traders may consider buying the stock or exploring call options.
Bearish Trend Analysis
The Stochastic Oscillator may be shifting from an upward trend to a downward trend. In of 65 cases where WPP's Stochastic Oscillator exited the overbought zone, the price fell further within the following month. The odds of a continued downward trend are .
Following a 3-day decline, the stock is projected to fall further. Considering past instances where WPP declined for three days, the price rose further in of 62 cases within the following month. The odds of a continued downward trend are .
The Aroon Indicator for WPP entered a downward trend on November 10, 2025. This could indicate a strong downward move is ahead for the stock. Traders may want to consider selling the stock or buying put options.
Fundamental Analysis (Ratings)
The Tickeron Valuation Rating of (best 1 - 100 worst) indicates that the company is seriously undervalued in the industry. This rating compares market capitalization estimated by our proprietary formula with the current market capitalization. This rating is based on the following metrics, as compared to industry averages: P/B Ratio (1.007) is normal, around the industry mean (30.944). P/E Ratio (8.536) is within average values for comparable stocks, (45.675). Projected Growth (PEG Ratio) (4.229) is also within normal values, averaging (3.219). WPP has a moderately high Dividend Yield (0.111) as compared to the industry average of (0.047). P/S Ratio (0.229) is also within normal values, averaging (4374.987).
The Tickeron Seasonality Score of (best 1 - 100 worst) indicates that the company is fair valued in the industry. The Tickeron Seasonality score describes the variance of predictable price changes around the same period every calendar year. These changes can be tied to a specific month, quarter, holiday or vacation period, as well as a meteorological or growing season.
The Tickeron Price Growth Rating for this company is (best 1 - 100 worst), indicating slightly worse than average price growth. WPP’s price grows at a lower rate over the last 12 months as compared to S&P 500 index constituents.
The Tickeron SMR rating for this company is (best 1 - 100 worst), indicating weak sales and an unprofitable business model. SMR (Sales, Margin, Return on Equity) rating is based on comparative analysis of weighted Sales, Income Margin and Return on Equity values compared against S&P 500 index constituents. The weighted SMR value is a proprietary formula developed by Tickeron and represents an overall profitability measure for a stock.
The Tickeron PE Growth Rating for this company is (best 1 - 100 worst), pointing to worse than average earnings growth. The PE Growth rating is based on a comparative analysis of stock PE ratio increase over the last 12 months compared against S&P 500 index constituents.
The Tickeron Profit vs. Risk Rating rating for this company is (best 1 - 100 worst), indicating that the returns do not compensate for the risks. WPP’s unstable profits reported over time resulted in significant Drawdowns within these last five years. A stable profit reduces stock drawdown and volatility. The average Profit vs. Risk Rating rating for the industry is 94, placing this stock worse than average.
Advertisement
General Information
a provider of communications services on a national, multinational and global basis
Industry AdvertisingMarketingServices