


In 2025 cryptocurrency markets, AI trading robots generate strong performance.
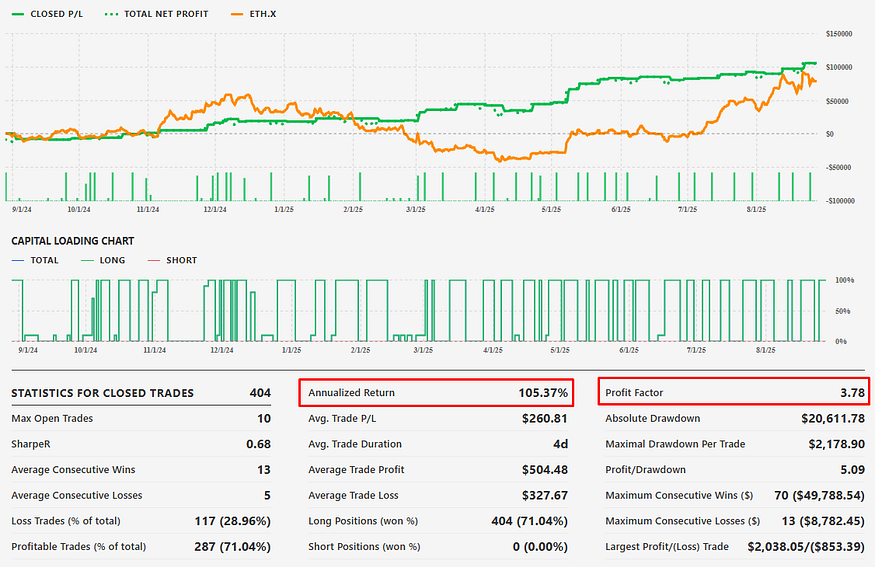
Tickeron, a leader in AI-driven financial solutions, announces groundbreaking performance results for its Crypto AI Trading Robots, achieving annualized returns of up to 85% for ETH.X, 56% for OM.X, and 49% for XRP.X in 2025, powered by advanced Financial Learning Models (FLMs).
Unprecedented Performance in Crypto Trading
Tickeron’s AI Trading Robots have demonstrated exceptional results in the volatile crypto market. For ETH.X, the robots secured a strong performance with a closed trades profit/loss (P/L) of $111,412. OM.X followed with a strong performance and $72,352 P/L, while XRP.X achieved a strong performance with $63,803 P/L. Each robot operates with a $100,000 adjustable trading balance and $10,000 per trade, ensuring consistent and scalable performance.
Financial Learning Models Drive Success
Led by CEO Sergey Savastiouk, Ph.D., Tickeron’s FLMs combine technical analysis with machine learning to identify high-probability trading patterns. These models enable real-time adaptability, empowering traders to navigate market volatility with precision. “Our FLMs integrate AI with market insights, offering both beginners and professionals unparalleled decision-making tools,” said Savastiouk.
Beginner-Friendly and Transparent Tools
Tickeron’s robots cater to all trader levels, featuring intuitive interfaces and real-time notifications for open and closed trades. With 445–452 days of operational data, these robots provide transparency through detailed performance stats, fostering trust and engagement. High-liquidity strategies ensure efficient execution in fast-moving crypto markets.
Shaping the Future of Crypto Trading
Tickeron’s AI solutions are redefining crypto trading in 2025, offering unmatched returns and risk management. By leveraging FLMs, traders gain a competitive edge, capitalizing on market opportunities with minimal emotional bias. For more details, visit Tickeron.com.
Contributor
Serhii Bondarenko is an AI-focused trading strategist and financial markets analyst specializing in the development and application of AI trading bots and autonomous trading agents. His work combines technical analysis, fundamental analysis, and quantitative research to identify market patterns, forecast price movements, and analyze liquidity, volatility, and correlations across global stock markets. Serhii actively publishes market insights, forecasts, and trading frameworks on platforms such as Investing.com and Finextra, with a strong focus on AI-driven decision-making and next-generation algorithmic trading. His research aims to bridge the gap between traditional trading methodologies and advanced artificial intelligence, helping traders and investors navigate complex and rapidly evolving market conditions.
ETH.X's Indicator enters downward trend
The Aroon Indicator for ETH.X entered a downward trend on October 22, 2026. Tickeron's A.I.dvisor identified a pattern where the AroonDown red line was above 70 while the AroonUp green line was below 30 for three straight days. This could indicate a strong downward move is ahead for the stock. Traders may want to consider selling the stock or buying put options. A.I.dvisor looked at 199 similar instances where the Aroon Indicator formed such a pattern. In 120 of the 199 cases the stock moved lower. This puts the odds of a downward move at 60%.

Technical Analysis (Indicators)
Bearish Trend Analysis
The Momentum Indicator moved below the 0 level on October 07, 2026. You may want to consider selling the stock, shorting the stock, or exploring put options on ETH.X as a result. In 57 of 133 cases where the Momentum Indicator fell below 0, the stock fell further within the subsequent month. The odds of a continued downward trend are 43%.
The Moving Average Convergence Divergence Histogram (MACD) for ETH.X turned negative on September 28, 2026. This could be a sign that the stock is set to turn lower in the coming weeks. Traders may want to sell the stock or buy put options. Tickeron's A.I.dvisor looked at 65 similar instances when the indicator turned negative. In 33 of the 65 cases the stock turned lower in the days that followed. This puts the odds of success at 51%.
ETH.X moved below its 50-day moving average on October 08, 2026 date and that indicates a change from an upward trend to a downward trend.
The 10-day moving average for ETH.X crossed bearishly below the 50-day moving average on October 14, 2026. This indicates that the trend has shifted lower and could be considered a sell signal. In 10 of 20 past instances when the 10-day crossed below the 50-day, the stock continued to move higher over the following month. The odds of a continued downward trend are 50%.
Following a 3-day decline, the stock is projected to fall further. Considering past instances where ETH.X declined for three days, the price rose further in 50 of 62 cases within the following month. The odds of a continued downward trend are 44%.
Bullish Trend Analysis
The RSI Indicator points to a transition from a downward trend to an upward trend -- in cases where ETH.X's RSI Indicator exited the oversold zone, 15 of 40 resulted in an increase in price. Tickeron's analysis proposes that the odds of a continued upward trend are 38%.
The Stochastic Oscillator suggests the stock price trend may be in a reversal from a downward trend to an upward trend. 37 of 91 cases where ETH.X's Stochastic Oscillator exited the oversold zone resulted in an increase in price. Tickeron's analysis proposes that the odds of a continued upward trend are 41%.
Following a +2.74% 3-day Advance, the price is estimated to grow further. Considering data from situations where ETH.X advanced for three days, in 181 of 426 cases, the price rose further within the following month. The odds of a continued upward trend are 42%.
ETH.X may jump back above the lower band and head toward the middle band. Traders may consider buying the stock or exploring call options.
Market Cap
High and low price notable news
Volume
Fundamental Analysis Ratings
The average fundamental analysis ratings, where 1 is best and 100 is worst, are as follows

Advertisement