Go to the list of all blogs
Serhii Bondarenko's Avatar
published in Blogs
Sep 02, 2025
In 2025 cryptocurrency markets, AI trading robots generate 85% annualized returns.

In 2025 cryptocurrency markets, AI trading robots generate 85% annualized returns.

 Tickeron, a leader in AI-driven financial solutions, announces groundbreaking performance results for its Crypto AI Trading Robots, achieving annualized returns of up to 85% for ETH.X, 56% for OM.X, and 49% for XRP.X in 2025, powered by advanced Financial Learning Models (FLMs).

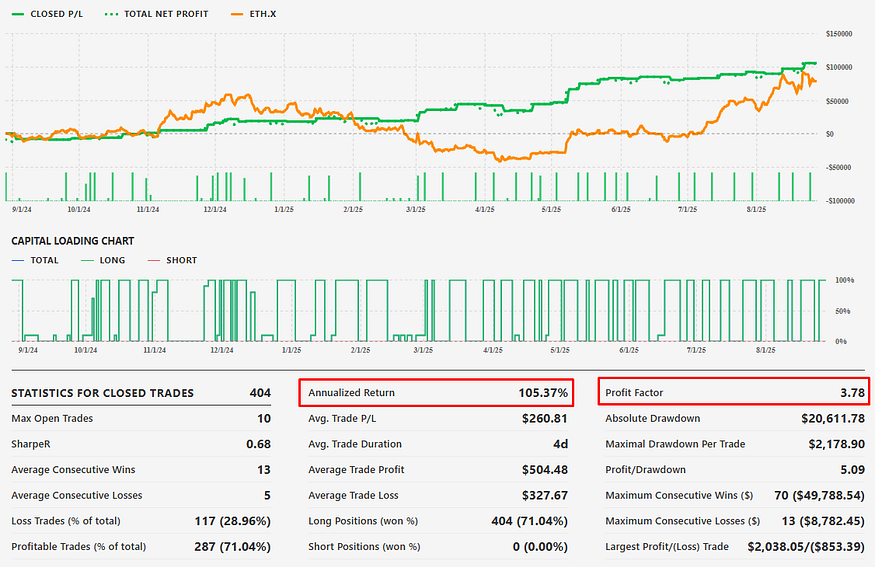
Unprecedented Performance in Crypto Trading

Tickeron’s AI Trading Robots have demonstrated exceptional results in the volatile crypto market. For ETH.X, the robots secured an 85% annualized return with a closed trades profit/loss (P/L) of $111,412. OM.X followed with a 56% return and $72,352 P/L, while XRP.X achieved a 49% return with $63,803 P/L. Each robot operates with a $100,000 adjustable trading balance and $10,000 per trade, ensuring consistent and scalable performance.

Financial Learning Models Drive Success

Led by CEO Sergey Savastiouk, Ph.D., Tickeron’s FLMs combine technical analysis with machine learning to identify high-probability trading patterns. These models enable real-time adaptability, empowering traders to navigate market volatility with precision. “Our FLMs integrate AI with market insights, offering both beginners and professionals unparalleled decision-making tools,” said Savastiouk.

Beginner-Friendly and Transparent Tools

Tickeron’s robots cater to all trader levels, featuring intuitive interfaces and real-time notifications for open and closed trades. With 445–452 days of operational data, these robots provide transparency through detailed performance stats, fostering trust and engagement. High-liquidity strategies ensure efficient execution in fast-moving crypto markets.

Shaping the Future of Crypto Trading

Tickeron’s AI solutions are redefining crypto trading in 2025, offering unmatched returns and risk management. By leveraging FLMs, traders gain a competitive edge, capitalizing on market opportunities with minimal emotional bias. For more details, visit Tickeron.com.

AI Trading for Stock Market | Tickeron

Disclaimers and Limitations

Related Ticker: ETH.X, XRP.X, OM.X

ETH.X in +1.74% Uptrend, advancing for three consecutive days on June 20, 2026

Moving higher for three straight days is viewed as a bullish sign. Keep an eye on this stock for future growth. Considering data from situations where ETH.X advanced for three days, in of 429 cases, the price rose further within the following month. The odds of a continued upward trend are .

Price Prediction Chart

Technical Analysis (Indicators)

Bullish Trend Analysis

The RSI Indicator points to a transition from a downward trend to an upward trend -- in cases where ETH.X's RSI Indicator exited the oversold zone, of 37 resulted in an increase in price. Tickeron's analysis proposes that the odds of a continued upward trend are .

The Momentum Indicator moved above the 0 level on June 15, 2026. You may want to consider a long position or call options on ETH.X as a result. In of 128 past instances where the momentum indicator moved above 0, the stock continued to climb. The odds of a continued upward trend are .

The Moving Average Convergence Divergence (MACD) for ETH.X just turned positive on June 14, 2026. Looking at past instances where ETH.X's MACD turned positive, the stock continued to rise in of 65 cases over the following month. The odds of a continued upward trend are .

ETH.X may jump back above the lower band and head toward the middle band. Traders may consider buying the stock or exploring call options.

Bearish Trend Analysis

The Stochastic Oscillator may be shifting from an upward trend to a downward trend. In of 82 cases where ETH.X's Stochastic Oscillator exited the overbought zone, the price fell further within the following month. The odds of a continued downward trend are .

Following a 3-day decline, the stock is projected to fall further. Considering past instances where ETH.X declined for three days, the price rose further in of 62 cases within the following month. The odds of a continued downward trend are .

The Aroon Indicator for ETH.X entered a downward trend on June 13, 2026. This could indicate a strong downward move is ahead for the stock. Traders may want to consider selling the stock or buying put options.

Market Cap

The average market capitalization across the group is 200.98B. The market cap for tickers in the group ranges from 200.98B to 200.98B. ETH.X holds the highest valuation in this group at 200.98B. The lowest valued company is ETH.X at 200.98B.

High and low price notable news

The average weekly price growth across all stocks in the group was -7%. For the same group, the average monthly price growth was -21%, and the average quarterly price growth was -43%. ETH.X experienced the highest price growth at -7%, while ETH.X experienced the biggest fall at -7%.

Volume

The average weekly volume growth across all stocks in the group was -24%. For the same stocks of the group, the average monthly volume growth was -18% and the average quarterly volume growth was -3%

Fundamental Analysis Ratings

The average fundamental analysis ratings, where 1 is best and 100 is worst, are as follows

Valuation Rating:
P/E Growth Rating:
Price Growth Rating:
SMR Rating:
Profit Risk Rating:
Seasonality Score: (-100 ... +100)
View a ticker or compare two or three
ETH.X
Daily Signal:
Gain/Loss:
Interact to see
Advertisement
A.I.Advisor
published price charts
Last 5 trading days
Interact to see
Advertisement
In the ever-shifting healthcare sector, CVS Health (CVS) and UnitedHealth Group (UNH) represent two powerhouse approaches: CVS as a retail pharmacy giant with integrated insurance and services, and UNH as a leading health insurer with diversified operations.
In the competitive retail landscape, American Eagle Outfitters (NYSE: AEO) is showing signs of robust upward potential as it navigates a strong 2025 performance.
In the dynamic world of satellite communications and broadband services, EchoStar Corporation (NASDAQ: SATS) has captured investor attention with a notable technical breakthrough. On December 8, 2025, the stock's 10-day moving average crossed above its 50-day moving average, signaling the onset of a bullish upward trend.
In an era where global investors demand instant access to markets, major players in the financial world are racing to extend trading hours beyond the traditional 9:30 a.m. to 4 p.m. ET window. This push is driven by surging foreign holdings of U.S. equities, which hit $17 trillion last year, and the growing appetite for nonstop trading in a 24/7 digital economy.
In the resilient gold mining sector, IAMGOLD Corporation (NYSE: IAG) has demonstrated an extraordinary uptrend throughout 2025, capitalizing on rising gold prices and operational milestones.
Within the rapidly evolving automotive retail landscape, Carvana Co. (NYSE: CVNA) has emerged as one of 2025’s standout performers. Once viewed as a highly volatile name, the company has transformed into a market leader as demand for online vehicle purchasing accelerates
Microsoft (MSFT) emerges as the AI-favored stock in 2025, outperforming Apple (AAPL) with a 16% year-to-date gain, compared to Apple’s 10% rise. The advantage stems from Microsoft’s deeper enterprise AI integration, accelerating cloud growth, and scalable software ecosystem.
ExxonMobil (XOM) emerges as the AI-preferred energy stock in 2025, posting a 10% year-to-date gain compared with Chevron’s (CVX) 2% increase. Stronger upstream production, exposure to high-growth assets, and expanding low-carbon initiatives support XOM’s momentum. Tickeron’s AI models signal continued upside for XOM, while CVX shows signs of overbought conditions and elevated downside risk.
Tesla (TSLA) emerges as the AI-preferred EV stock in 2025, posting a 19% year-to-date gain, while BYD (BYDDY) has declined 82%, reflecting diverging momentum across the global EV market. Tickeron’s AI trading bots indicate strong bullish conditions for TSLA, supported by positive momentum signals, whereas BYDDY shows sustained bearish trends.
Broadcom (AVGO) emerges as the AI-preferred semiconductor stock in 2025, posting a 48% year-to-date gain, compared with 37% for NVIDIA (NVDA), supported by stronger diversification across networking, infrastructure, and custom AI chips.
- Bio-Techne carries a “Moderate Buy” consensus from 13 analysts, with an average price target of $70.58, implying about 15% upside. - Recent positive revisions include TD Cowen (Oct. 14, target raised from $65 to $70, Strong Buy), Evercore ISI (Oct. 7, $60 to $72, Buy), and RBC -
Skyworks Solutions (SWKS) has traded unevenly in recent weeks as investors digest shifting sector dynamics and company-specific guidance. The stock has moved into a consolidation phase following broader semiconductor rotations, with optimism in diversified end markets offset by ongoing pressure in mobile.
Seagate Technology (STX) has emerged as one of the standout performers of 2025, powered by explosive demand for data storage tied to artificial intelligence workloads. As hyperscalers expand cloud and AI infrastructure, Seagate’s high-capacity hard drives have become essential, pushing the stock sharply higher and keeping investor attention firmly locked on upcoming earnings.
Home Depot and Lowe’s are the two dominant players in the home improvement retail space, frequently compared due to their similar product offerings and overlapping customer bases of DIY homeowners and professional contractors. Their performance is closely watched as a barometer for consumer discretionary spending, housing market trends, and interest rate impacts.
Over the past month, Wynn’s share price has been shaped by a combination of analyst actions, expansion-related news, and shifting industry dynamics. The stock reached a 52-week high in early December, supported by positive premarket activity and renewed optimism across consumer-facing sectors.
Visa (V) strengthened its leadership in global payments, advancing AI-driven tools, stablecoin advisory services, and enhanced security offerings in 2025.
Goldman Sachs and Morgan Stanley are leading global investment banks, frequently compared due to their overlapping operations in capital markets, wealth management, and advisory services. Evaluating these stocks side by side helps investors and traders understand differences in risk, growth potential, and revenue drivers amid ongoing macroeconomic shifts, tariff impacts, and a resurgence in deal-making activity.
Equinox Gold (EQX) and Coeur Mining (CDE) are notable players in the precious metals mining sector, focusing on gold and silver production in a market influenced by economic uncertainty, inflation hedges, and global demand. This comparison provides insight for investors tracking commodity trends or seeking safe-haven assets.
Strategic Acquisitions and Expansion: USAR acquired UK-based Less Common Metals, integrating rare earth metal and magnet production to create a comprehensive magnet-to-mine supply chain. Production Acceleration: Construction at the Round Top facility in Texas has been advanced, with commercial production now expected by late 2028—two years ahead of the original schedule.