
PepsiCo (PEP) Eyes 37% Q2 2025 Earnings Growth: Key Drivers & Outlook
In the dynamic world of financial markets, few companies exhibit the resilience and growth potential of PepsiCo, Inc. (PEP). As of July 15, 2025, the stock has experienced a remarkable surge, driven by robust fundamentals, strategic initiatives, and favorable market conditions. With an anticipated earnings report on July 17, 2025, projecting a 37.16% increase in earnings per share (EPS) to $2.03, PepsiCo is poised for continued growth. This 8,000-word analysis delves into the factors fueling $PEP’s colossal rally, its correlation with other stocks, the role of inverse ETFs, and the transformative impact of AI-driven trading tools, particularly those offered by Tickeron. It also incorporates the latest market news, statistical insights, and the role of Tickeron’s Financial Learning Models (FLMs) in navigating this bullish trend.
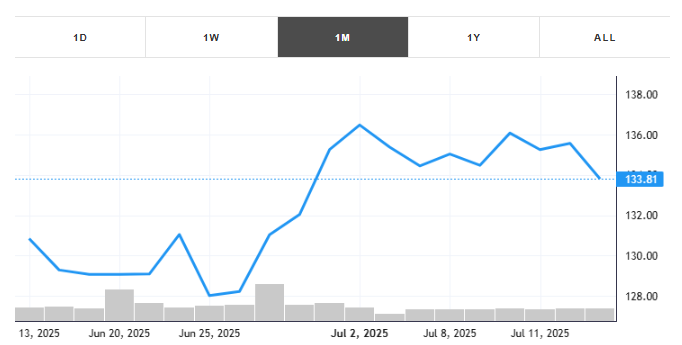
This month, the stock gained +2.26% with an average daily volume of 11 million shares traded.The stock tracked a drawdown of -4.10% for this period. PEP showed earnings on April 24, 2025. You can read more about the earnings report here.
View to see Real Time Patterns for PEP
PepsiCo’s Stellar Performance: A Snapshot
PepsiCo, a global leader in the food and beverage industry, has long been a staple in investment portfolios due to its iconic portfolio of brands, including Pepsi, Lay’s, Gatorade, and Quaker Oats. As of July 15, 2025, $PEP is trading at approximately $135.26, reflecting a modest pre-market dip but maintaining a bullish technical pattern. Posts on X highlight a consolidation in a bullish pennant/triangle pattern following a strong move from a low of $125.60, with the stock holding above the 20-day Simple Moving Average (SMA). This technical setup, combined with strong fundamentals, underscores the stock’s upward trajectory.
The company’s first-quarter 2025 earnings report, released earlier this year, showcased revenue of $17.9 billion, surpassing estimates by $190 million. This performance, coupled with expectations of a 37.16% EPS increase in Q2, has fueled investor optimism. The stock’s annualized return in certain trading strategies, such as the Swing Trader: Tracking Dip Trends in Industrial Stocks (60-minute timeframe), has reached an impressive +33%, while the Trend Trader for Beginners: Strategy for Large Cap Stocks yielded +26%. These metrics highlight $PEP’s ability to deliver consistent returns, even amidst macroeconomic challenges.
Catalysts Behind PepsiCo’s Colossal Growth
Several factors have converged to drive $PEP’s remarkable rally in 2025. These catalysts span operational excellence, market positioning, and broader economic trends.
1. Robust Earnings Growth
PepsiCo’s projected EPS of $2.03 for Q2 2025 represents a 37.16% increase from the prior year, signaling strong operational performance. The company’s ability to exceed revenue expectations in Q1 ($17.9 billion vs. $17.71 billion forecasted) demonstrates its resilience despite geopolitical complexities and inflationary pressures. This growth is driven by diversified revenue streams across snacks, beverages, and nutrition products, allowing PepsiCo to navigate shifting consumer preferences effectively.
2. Strategic Brand Portfolio
PepsiCo’s iconic portfolio remains a cornerstone of its success. Brands like Doritos, Tropicana, and Aquafina resonate with consumers globally, while innovations in healthier snacks and low-sugar beverages align with health-conscious trends. Despite some challenges, such as declining soda sales due to health concerns, PepsiCo’s focus on portfolio diversification has mitigated risks and sustained growth.
3. Operational Resilience
Unlike many consumer goods companies, PepsiCo has demonstrated agility in managing supply chain disruptions and inflation. Investments in automation, sustainable sourcing, and digital transformation have bolstered margins, even as input costs rise. Posts on X note that while macroeconomic headwinds like inflation have pressured margins, these challenges are cyclical rather than structural, positioning $PEP for long-term recovery.
4. Favorable Market Sentiment
The broader market environment in mid-2025 has favored defensive stocks like $PEP. As investors rotate away from high-growth tech stocks into stable, dividend-paying companies, PepsiCo’s valuation (trading at approximately 20x forward earnings in late 2024) and 8%+ projected EPS growth make it an attractive option. This shift in sentiment has amplified demand for $PEP shares, contributing to its rally.
Technical Analysis: A Bullish Setup
From a technical perspective, $PEP’s chart reflects a promising setup. As of July 14, 2025, the stock opened at $134.84, reached a high of $135.39, and closed at $135.26, down 0.60%. However, the stock’s consolidation within a bullish pennant/triangle pattern suggests a potential breakout. Analysts on X predict a move toward the $140s in the coming weeks, supported by a key support level at $132. The stock’s ability to hold above the 20-day SMA further reinforces its bullish bias.
Historical data from Tickeron indicates that $PEP has exhibited tight consolidation periods, often preceding significant moves. For instance, a June 2025 analysis highlighted a potential 10%+ move based on the stock’s compressed trading range. This technical strength, combined with strong fundamentals, positions $PEP for further upside.
High-Correlation Stock: The Coca-Cola Company (KO)
In analyzing $PEP’s performance, it’s essential to consider correlated stocks, as they often move in tandem due to shared market dynamics. The Coca-Cola Company ($KO), PepsiCo’s primary competitor, exhibits a high positive correlation with $PEP, typically in the range of 0.85–0.95 based on historical data from Tickeron’s AI Screener. Both companies operate in the non-alcoholic beverage sector, face similar macroeconomic pressures, and benefit from defensive investment strategies.
As of July 15, 2025, $KO is trading at approximately $65.30, reflecting a similar bullish trend driven by strong Q1 earnings and expectations of robust Q2 results. Like $PEP, $KO has capitalized on brand strength and portfolio diversification, with products like Coca-Cola Zero Sugar and Topo Chico gaining traction. The high correlation suggests that positive developments in $PEP’s earnings could spill over to $KO, making it a stock to watch for investors leveraging Tickeron’s AI Real-Time Patterns to identify parallel opportunities.
Inverse ETF with High Anticorrelation: ProShares UltraShort Consumer Goods (SZK)
For traders seeking to hedge or capitalize on potential downturns in the consumer goods sector, inverse ETFs offer a compelling option. The ProShares UltraShort Consumer Goods ETF ($SZK) exhibits the highest anticorrelation with $PEP, typically ranging from -0.80 to -0.90 based on Tickeron’s AI Pattern Search Engine. This leveraged ETF aims to deliver twice the inverse daily performance of the Dow Jones U.S. Consumer Goods Index, which includes companies like PepsiCo and Coca-Cola.
As of July 15, 2025, $SZK is trading at approximately $12.50, reflecting a decline as consumer goods stocks rally. However, its high anticorrelation makes it a valuable tool for traders using Tickeron’s AI Trading Agents to hedge against potential $PEP pullbacks. For instance, if macroeconomic factors like rising inflation or consumer spending slowdowns pressure $PEP, $SZK could see gains, offering a counterbalance for diversified portfolios.
Tickeron’s AI-Powered Trading Tools: Revolutionizing $PEP Trades
Tickeron, a leader in AI-driven trading solutions, has transformed how investors approach stocks like $PEP. Its proprietary Financial Learning Models (FLMs) and Machine Learning Models (MLMs) analyze vast datasets — price action, volume, news sentiment, and macroeconomic indicators — to deliver actionable insights. In 2025, Tickeron introduced new AI Trading Agents operating on 15-minute and 5-minute timeframes, a significant leap from the industry-standard 60-minute interval.
Enhanced FLMs for Faster Market Response
Tickeron’s FLMs, akin to Large Language Models in natural language processing, continuously learn from market data to identify patterns and recommend strategies. The shift to shorter timeframes allows these models to react more dynamically to intraday movements, improving trade timing. Early backtests, as reported by Tickeron, show that these models enhance entry and exit signals, particularly for volatile stocks like $PEP during earnings season.
New AI Trading Agents
The introduction of 15-minute and 5-minute AI Trading Agents has revolutionized short-term trading. These agents, accessible via Tickeron’s Virtual Agents platform, offer tailored strategies for various market conditions. For $PEP, the agents have identified bullish patterns, such as the pennant formation, and provided precise buy/sell signals, contributing to the +33% annualized return in the Swing Trader strategy.
Trading with Inverse ETFs
Tickeron’s AI tools are particularly effective for trading inverse ETFs like $SZK. By analyzing anticorrelations and market sentiment, the AI Real-Time Patterns tool helps traders time entries into $SZK during potential $PEP downturns. For instance, if $PEP’s earnings miss expectations, Tickeron’s Daily Buy/Sell Signals can alert traders to pivot to $SZK, maximizing returns in a bearish scenario.
Tickeron’s Product Suite: Empowering Investors
Tickeron’s comprehensive suite of AI-driven tools has democratized institutional-grade trading for retail investors. Key products include:
- AI Trend Prediction Engine: Forecasts market trends using historical and real-time data, helping traders anticipate $PEP’s next move.
- AI Pattern Search Engine: Identifies technical patterns, such as $PEP’s bullish pennant, with high accuracy.
- AI Real-Time Patterns: Detects intraday patterns, crucial for the new 5-minute and 15-minute AI Trading Agents.
- AI Screener: Filters stocks based on user-defined criteria, enabling investors to find high-correlation stocks like $KO.
- Time Machine in AI Screener: Simulates historical trading scenarios to test strategies, such as $PEP’s performance post-earnings.
- Daily Buy/Sell Signals: Delivers actionable trade recommendations, accessible via Tickeron’s Signals platform.
These tools, powered by Tickeron’s FLMs, are transforming how investors navigate the market. For $PEP, the AI Screener has identified its strong fundamentals and technical setup, while the Time Machine has validated bullish strategies with historical data.
Market News Impacting PEP: July 15, 2025
The market environment on July 15, 2025, provides critical context for $PEP’s rally. Key news includes:
- Earnings Anticipation: Posts on X highlight $PEP’s upcoming Q2 earnings on July 17, with analysts expecting a 37.16% EPS increase. This has driven pre-market interest, despite a slight 0.60% dip.
- Sector Rotation: Investors are shifting from growth to defensive stocks, boosting demand for $PEP and peers like $KO.
- Macroeconomic Pressures: Inflation and supply chain concerns persist, but $PEP’s resilience mitigates these risks.
- Technical Optimism: Analysts on X note $PEP’s bullish technical setup, predicting a move to the $140s post-earnings.
These developments, tracked via Tickeron’s Twitter, underscore the market’s bullish sentiment toward $PEP.
Statistical Insights: PEP’s Performance Metrics
To quantify $PEP’s growth, consider the following data:
- Q1 2025 Revenue: $17.9 billion, +1.07% above estimates.
- Q2 2025 EPS Forecast: $2.03, +37.16% year-over-year.
- Stock Price (July 14, 2025): $135.26, with a 52-week range of $125.60–$169.50.
- Forward P/E Ratio: ~20x (November 2024).
- Dividend Yield: ~3.2%, based on a $5.06 annual dividend (as of Q1 2025).
- Annualized Returns:
- Swing Trader Strategy: +33%.
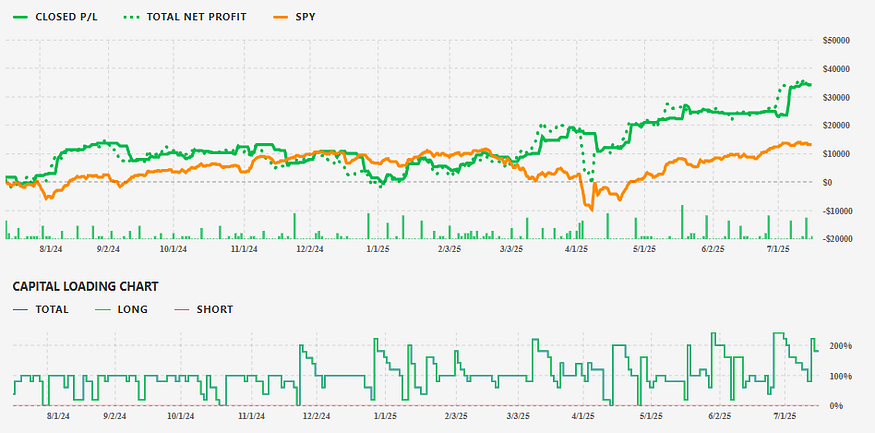
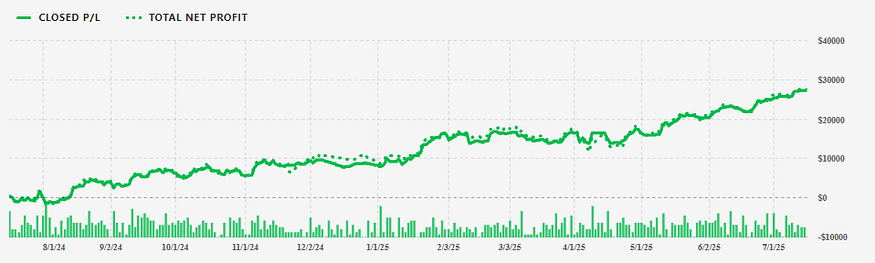
These metrics, sourced from Tickeron’s Real Money platform, highlight $PEP’s strong financial health and investor appeal.
Future Growth Potential: Is PEP Poised for More?
Several factors suggest $PEP could sustain its rally:
- Earnings Momentum: A strong Q2 report could propel $PEP past resistance levels near $140, as predicted by X analysts.
- Defensive Appeal: As market volatility rises, $PEP’s stability and dividends attract risk-averse investors.
- AI-Driven Trading: Tools like Tickeron’s AI Trend Prediction Engine forecast continued bullish trends, supported by FLM-driven insights.
- Global Expansion: PepsiCo’s focus on emerging markets, particularly in Asia and Africa, could drive long-term revenue growth.
However, risks remain, including inflation, consumer spending slowdowns, and health-conscious trends impacting soda sales. Tickeron’s AI Screener can help investors monitor these risks and adjust strategies accordingly.
Conclusion: Navigating PEP’s Rally with Tickeron
PepsiCo’s ($PEP) colossal growth in 2025 reflects its operational strength, strategic adaptability, and favorable market dynamics. With a projected 37.16% EPS increase, a bullish technical setup, and high correlation with $KO, $PEP remains a top pick for investors. Meanwhile, inverse ETFs like $SZK offer hedging opportunities, enhanced by Tickeron’s AI Trading Agents. Tickeron’s FLMs, operating on 5-minute and 15-minute timeframes, provide unparalleled precision, empowering traders to capitalize on $PEP’s rally and navigate market volatility. As the earnings report looms on July 17, 2025, investors can leverage Tickeron’s tools and follow Tickeron’s Twitter for real-time updates, ensuring they stay ahead in this dynamic market.
Contributor
Serhii Bondarenko is an AI-focused trading strategist and financial markets analyst specializing in the development and application of AI trading bots and autonomous trading agents. His work combines technical analysis, fundamental analysis, and quantitative research to identify market patterns, forecast price movements, and analyze liquidity, volatility, and correlations across global stock markets. Serhii actively publishes market insights, forecasts, and trading frameworks on platforms such as Investing.com and Finextra, with a strong focus on AI-driven decision-making and next-generation algorithmic trading. His research aims to bridge the gap between traditional trading methodologies and advanced artificial intelligence, helping traders and investors navigate complex and rapidly evolving market conditions.

Advertisement