Real-time pattern trading is a smart way to find entry and exit prices if you can scan thousands of stocks and ETFs within minutes. It is definitely impossible for humans. Artificial Intelligence (A.I.) not only discovers these patterns, but also checks if they worked out well in the past. Knowing the success rate in the past allows A.I. to establish the odds of success in the future.
The Head and Shoulders pattern has five points to it. There is the left shoulder, the left side visit to the neckline area, the head, the right side visit to the neckline, and the right shoulder. Ahead and shoulders pattern appears as a baseline with three peaks, the outside two are close in height and the middle is highest.
The image below is an example of the bearish head and shoulders pattern:
The stock is on the rise and then it cycles lower as investors take some profits. That temporary high forms the left shoulder.
After a brief pullback, investors start buying again and the next upward cycle starts. That brief pullback and the temporary low create the left side of the neck. The next cycle moves above the first high and forms the head. Once again investors decide to take some profits off the table and the next downward cycle takes the stock back down to form the right side of the neck.
The head and shoulders pattern is presumed to be one of the most reliable trend reversal patterns.
Investors see the temporary pullback as a buying opportunity and drive the stock higher once again, but the stock doesn’t have enough momentum to get as high as the head. This third high is near the same level as the first high and forms the right shoulder.
Because the momentum wasn’t enough to carry it to a new high, there is more momentum to the downside and the stock moves below the neckline. At the point where the stock moves below the neckline, that is the confirmation point of a bearish head and shoulders pattern. The probability for the downside momentum to continue is pretty high at this point.
Here is how the shape of the pattern can be interpreted: After long bearish trends, the price rises to a peak and subsequently declines to form a trough. The price rises again to form a second high substantially above the initial peak and declines again. The price rises a third time, but only to the level of the first peak, before declining once more.
Tickeron’s AI works to analyze patterns in order to give you the chance to make better trading decisions. Our tools, like the Pattern Search Engine and Real-Time Patterns, provide you with the knowledge you need to track stocks, ETFs, Mutual Funds and FOREX pairs.
Statistics are what make Tickeron’s AI so powerful. Here’s how we analyze these patterns:
Tickeron tracks and backtests the stats for eachhead-and-shoulders pattern detected by our AI, and provides the user with this data so that they can make an informed trade, having weighed the risks and possibilities.
The investor obtains statistics on the patterns that are detected by AI and what percentage of them hit their target price. They are then presented with the potential gain or loss that the investor would have encountered if they would have traded the pattern.
With just a few clicks, the user sees the following:
The AI also has different “confidence levels” to describe how likely it is that a pattern will play out, and the user can adjust confidence levels higher or lower to obtain different statistics.
For example, if Tickeron’s AI is asked to detect allhead-and-shoulders bearish patterns with a 60%+ confidence level and a greater than 5% distance to the target price (potential profit), then the user would discover that Tickeron’s AI has discovered 3,497 confirmed patterns meeting that criteria, having searched about 4000 stocks, around 10,000 ETFs and hundreds of FOREX pairs.
If you’ve never seen technology like this before, it’s because it has never been available to retail investors in this format. The idea is to provide retail investors with technology and tools to enable trading with massive amounts of data and analysis. The end result is arming retail investors with a high-powered, virtual research assistant: Tickeron’s Artificial Intelligence.
Time frames No matter your trading strategy (day trading, swing, etc), we have patterns that will be ready to trade.
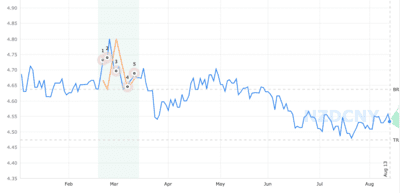
NZDCNY - New Zealand Dollar - China Yuan
| STATUS | Emerged |
|---|---|
| CURRENT CONFIDENCE | 62% |
| TARGET (EXIT) PRICE | 4.637620 CNY |
| BREAKOUT (ENTRY) PRICE | 4.474640 CNY |
| DISTANCE TO TARGET PRICE | 1.28% (579.1 pips) |
| EMERGED ON | Mar 12, closing price |
| WITH CONFIDENCE LEVEL | 0% |
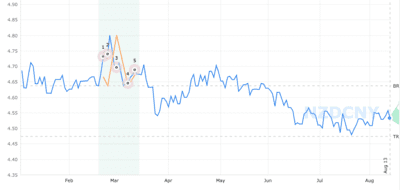
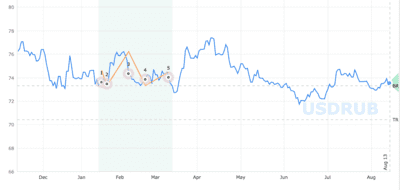
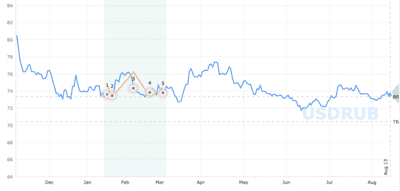
USDRUB - United States Dollar - Russia Ruble
| STATUS | Emerged |
|---|---|
| CURRENT CONFIDENCE | 51% |
| TARGET (EXIT) PRICE | 73.328651 RUB |
| BREAKOUT (ENTRY) PRICE | 70.436798 RUB |
| DISTANCE TO TARGET PRICE | 4.22% (310.3 pips) |
| EMERGED ON | Mar 10, closing price |
| WITH CONFIDENCE LEVEL | 0% |
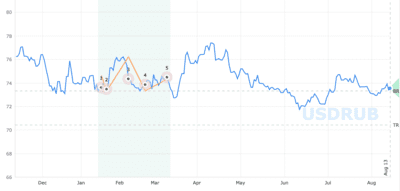
USDRUB - United States Dollar - Russia Ruble
| STATUS | Emerged |
|---|---|
| CURRENT CONFIDENCE | 51% |
| TARGET (EXIT) PRICE | 73.328651 RUB |
| BREAKOUT (ENTRY) PRICE | 70.436798 RUB |
| DISTANCE TO TARGET PRICE | 4.22% (310.3 pips) |
| EMERGED ON | Mar 09, closing price |
| WITH CONFIDENCE LEVEL | 0% |
USDRUB - United States Dollar - Russia Ruble
| STATUS | Emerged |
|---|---|
| CURRENT CONFIDENCE | 54% |
| TARGET (EXIT) PRICE | 73.328651 RUB |
| BREAKOUT (ENTRY) PRICE | 70.436798 RUB |
| DISTANCE TO TARGET PRICE | 4.22% (310.3 pips) |
| EMERGED ON | Mar 03, closing price |
| WITH CONFIDENCE LEVEL | 0% |