Real-time pattern trading is a smart way to find entry and exit prices if you can scan thousands of stocks and ETFs within minutes. It is definitely impossible for humans. Artificial Intelligence (A.I.) not only discovers these patterns, but also checks if they worked out well in the past. Knowing the success rate in the past allows A.I. to establish the odds of success in the future.
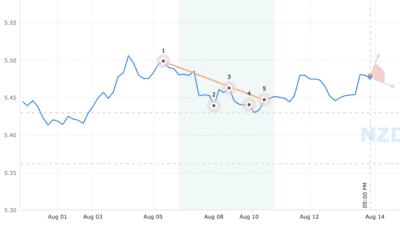
The Ascending Triangle pattern has a horizontal top line (1, 3, 5) representing a resistance level, and an upward-sloping bottom line (2, 4). The Breakout can either be up or down, and the direction of the Breakout will determine whether the Target Price is higher or lower.
This pattern is commonly associated with directionless markets, since the contraction (narrowing) of the market range signals that neither bulls nor bears are in control. When the price of a security consolidates around highs it might indicate that a significant downtrend is ahead.
If the price breaks out from the bottom pattern boundary, day traders and swing traders should trade with the DOWN trend. Consider selling the security short or buying a put option on the downward breakout price. To identify an exit, compute the target price by subtracting the pattern height from the breakout point. For downward breakouts the breakout level is the price at the lowest low within the triangle (2). The pattern height is the difference between the level of the top horizontal line and the lowest low.
To limit potential loss when price suddenly goes in the wrong direction, consider placing a stop order to buy back a short position or sell a put option at or above the breakout price.
Time frames No matter your trading strategy (day trading, swing, etc), we have patterns that will be ready to trade.
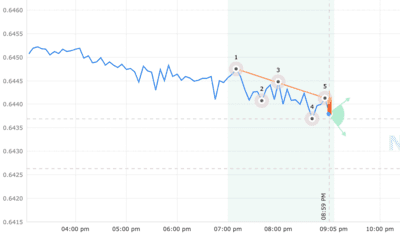
USDNZD - United States Dollar - New Zealand Dollar
| STATUS | Emerged |
|---|---|
| CURRENT CONFIDENCE | 19% |
| TARGET (EXIT) PRICE | 1.418842 NZD |
| BREAKOUT (ENTRY) PRICE | 1.417688 NZD |
| DISTANCE TO TARGET PRICE | 0.17% (24.2 pips) |
| EMERGED ON | Aug 13, 06:25 PM (UTC) |
| WITH CONFIDENCE LEVEL | 36% |
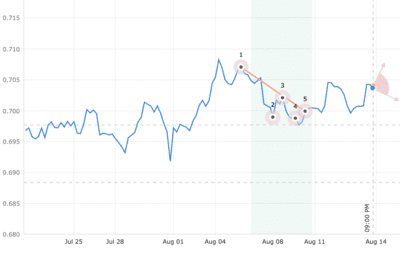
NZDCNY - New Zealand Dollar - China Yuan
| STATUS | Emerged |
|---|---|
| CURRENT CONFIDENCE | 35% |
| TARGET (EXIT) PRICE | 4.479870 CNY |
| BREAKOUT (ENTRY) PRICE | 4.407180 CNY |
| DISTANCE TO TARGET PRICE | 3.21% (1,463.1 pips) |
| EMERGED ON | Aug 13, closing price |
| WITH CONFIDENCE LEVEL | 35% |
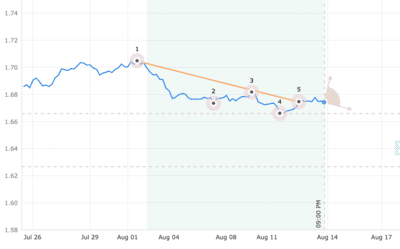
USDNZD - United States Dollar - New Zealand Dollar
| STATUS | Emerged |
|---|---|
| CURRENT CONFIDENCE | 21% |
| TARGET (EXIT) PRICE | 1.343130 NZD |
| BREAKOUT (ENTRY) PRICE | 1.286090 NZD |
| DISTANCE TO TARGET PRICE | 9.45% (1,342.2 pips) |
| EMERGED ON | Mar 24, closing price |
| WITH CONFIDENCE LEVEL | 21% |
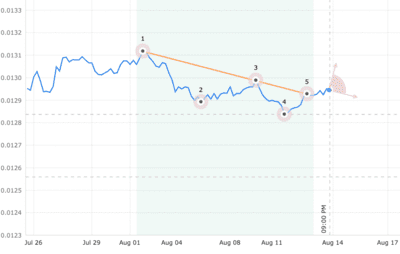
RUBUSD - Russia Ruble - United States Dollar
| STATUS | Emerged |
|---|---|
| CURRENT CONFIDENCE | 51% |
| TARGET (EXIT) PRICE | 0.013110 USD |
| BREAKOUT (ENTRY) PRICE | 0.012600 USD |
| DISTANCE TO TARGET PRICE | 7.62% (104.0 pips) |
| EMERGED ON | Mar 12, closing price |
| WITH CONFIDENCE LEVEL | 0% |
RUBUSD - Russia Ruble - United States Dollar
| STATUS | Emerged |
|---|---|
| CURRENT CONFIDENCE | 51% |
| TARGET (EXIT) PRICE | 0.013110 USD |
| BREAKOUT (ENTRY) PRICE | 0.012610 USD |
| DISTANCE TO TARGET PRICE | 7.55% (103.0 pips) |
| EMERGED ON | Feb 26, closing price |
| WITH CONFIDENCE LEVEL | 0% |