Real-time pattern trading is a smart way to find entry and exit prices if you can scan thousands of stocks and ETFs within minutes. It is definitely impossible for humans. Artificial Intelligence (A.I.) not only discovers these patterns, but also checks if they worked out well in the past. Knowing the success rate in the past allows A.I. to establish the odds of success in the future.
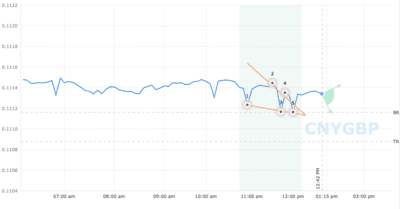
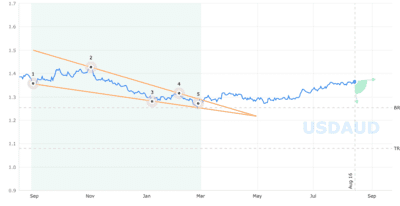
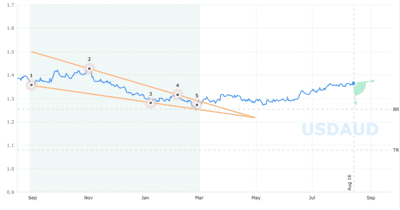
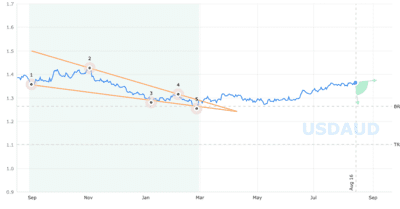
The Falling Wedge pattern forms when prices appear to spiral downward, with lower lows (1, 3, 5) and lower highs (2, 4) creating two down-sloping trend lines that intersect to form a triangle. Unlike Descending Triangle patterns, however, both lines need to have a distinct downward slope, with the top line having a steeper decline.
This pattern is commonly associated with directionless markets since the contraction (narrowing) of the market range signals that neither bulls nor bears are in control. However, there is a distinct possibility that market participants will either pour in or sell out, and the price can move up or down with big volumes (leading up to the breakout).
If the price breaks out from the bottom pattern boundary, day traders and swing traders should trade with the DOWN trend. Consider selling a security short or buying a put option at the downward breakout price level. To identify an exit, compute the target price by subtracting the pattern height from the breakout level. The pattern height is the difference between the highest high and the lowest low within the pattern, and the breakout level is the lowest point within the triangle.
To limit potential loss when price suddenly goes in the wrong direction, consider placing a stop order to buy back a short position or sell a put option at or above the breakout price.
Time frames No matter your trading strategy (day trading, swing, etc), we have patterns that will be ready to trade.
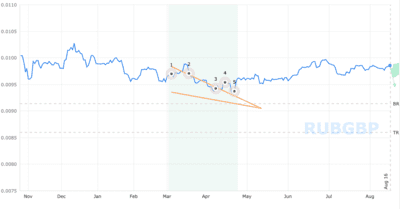
USDRUB - United States Dollar - Russia Ruble
| STATUS | Emerged |
|---|---|
| CURRENT CONFIDENCE | 51% |
| TARGET (EXIT) PRICE | 74.677872 RUB |
| BREAKOUT (ENTRY) PRICE | 73.722565 RUB |
| DISTANCE TO TARGET PRICE | 1.65% (121.5 pips) |
| EMERGED ON | Aug 03, closing price |
| WITH CONFIDENCE LEVEL | 53% |
EURHKD - Euro - Hong Kong Dollar
| STATUS | Emerged |
|---|---|
| CURRENT CONFIDENCE | 73% |
| TARGET (EXIT) PRICE | 9.566050 HKD |
| BREAKOUT (ENTRY) PRICE | 9.432670 HKD |
| DISTANCE TO TARGET PRICE | 4.58% (4,188.0 pips) |
| EMERGED ON | Feb 05, closing price |
| WITH CONFIDENCE LEVEL | 0% |
EURHKD - Euro - Hong Kong Dollar
| STATUS | Emerged |
|---|---|
| CURRENT CONFIDENCE | 62% |
| TARGET (EXIT) PRICE | 9.566050 HKD |
| BREAKOUT (ENTRY) PRICE | 9.432670 HKD |
| DISTANCE TO TARGET PRICE | 4.58% (4,188.0 pips) |
| EMERGED ON | Feb 05, closing price |
| WITH CONFIDENCE LEVEL | 0% |
EURHKD - Euro - Hong Kong Dollar
| STATUS | Emerged |
|---|---|
| CURRENT CONFIDENCE | 56% |
| TARGET (EXIT) PRICE | 9.566050 HKD |
| BREAKOUT (ENTRY) PRICE | 9.432670 HKD |
| DISTANCE TO TARGET PRICE | 4.58% (4,188.0 pips) |
| EMERGED ON | Feb 05, closing price |
| WITH CONFIDENCE LEVEL | 0% |
EURHKD - Euro - Hong Kong Dollar
| STATUS | Emerged |
|---|---|
| CURRENT CONFIDENCE | 64% |
| TARGET (EXIT) PRICE | 9.566050 HKD |
| BREAKOUT (ENTRY) PRICE | 9.432670 HKD |
| DISTANCE TO TARGET PRICE | 4.58% (4,188.0 pips) |
| EMERGED ON | Feb 05, closing price |
| WITH CONFIDENCE LEVEL | 0% |