Trading patterns is one of the most sophisticated trading strategies. It exploits the psychology of market participants, and takes advantage of the knowledge of market insights.If you want to use AI to discover these hidden effects, then Tickeron’s Pattern Search Engine is the tool you need. Using PSE, AI will teach you to recognize patterns and entry and exit points.
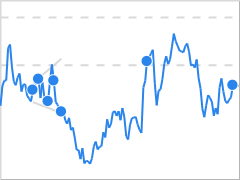
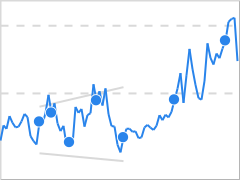
A broadening bottom can be characterized as a bullish reversal pattern. It consists of two divergent lines that form a triangle. The movements between the two triangle sides increase as the pattern continues. Each side must be touched at least twice to be validated.
The Broadening Bottom pattern is formed when the price of a security progressively makes higher highs (2, 4) and lower lows (1, 3, 5) following two widening trend lines. The price is expected to move up or down past the pattern depending on which line is broken first. What distinguishes a Broadening Bottom from a Broadening Top is that the price of the security is declining prior to entering the pattern formation.
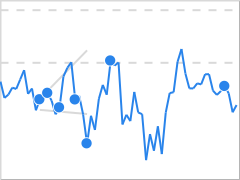
Once the price breaks out from the top pattern boundary, day traders and swing traders should trade with an UP trend. Consider buying a security or a call option at the upward breakout price/entry point. To identify an exit, compute the target price by adding the pattern height (H on the chart) to the breakout price. The pattern height is the difference between the pattern’s highest high and its lowest low.
To limit potential loss when the price suddenly goes in the wrong direction, consider placing a stop order to sell at or below the breakout price.
This type of formation happens when volatility is high or increasing, and when the price of a security is moving with high volatility but with little or no direction. It can potentially indicate growing investor nervousness and indecisiveness.
Tickeron’s AI works to analyze patterns in order to give you the chance to make better trading decisions. Our tools, like the Pattern Search Engine and Real-Time Patterns, provide you with the knowledge you need to track stocks, ETFs, Mutual Funds and FOREX pairs.
Statistics are what make Tickeron’s AI so powerful. Here’s how we analyze these patterns:
Tickeron tracks and backtests the stats for each cup-and-handle pattern detected by our AI, and provides the user with this data so that they can make an informed trade, having weighed the risks and possibilities.
The investor obtains statistics on the patterns that are detected by AI and what percentage of them hit their target price. They are then presented with the potential gain or loss that the investor would have encountered if they would have traded the pattern.
With just a few clicks, the user sees the following:
How many total cup-and-handle patterns AI recognized
How many of those patterns reached the target price
The average return if the pattern was successful versus if it failed; and,
The average return of all patterns recognized.
A list of all of the securities that the AI has identified over time in a cup-and-handle pattern.
The AI also has different “confidence levels” to describe how likely it is that a pattern will play out, and the user can adjust confidence levels higher or lower to obtain different statistics.
For example, if Tickeron’s AI is asked to detect all Broadening Bottom Bullish Patterns with a 30%+ confidence level and a greater than 7% distance to the target price (potential profit), then the user would discover that Tickeron’s AI has discovered 20,755 patterns meeting that criteria, having searched about 4000 stocks, around 10,000 ETFs and hundreds of FOREX. The user would also discover that 3,744 of those patterns reached the target price.
If you’ve never seen technology like this before, it’s because it has never been available to retail investors in this format. The idea is to provide retail investors with technology and tools to enable trading with massive amounts of data and analysis. The end result is arming retail investors with a high-powered, virtual research assistant: Tickeron’s Artificial Intelligence.