PAC Stock Tickeron detected bullish Stock Pattern: Cup-and-Handle PAC on November 10, 2025, netting in a 2.13% gain over 1 week


at Tickeron.com


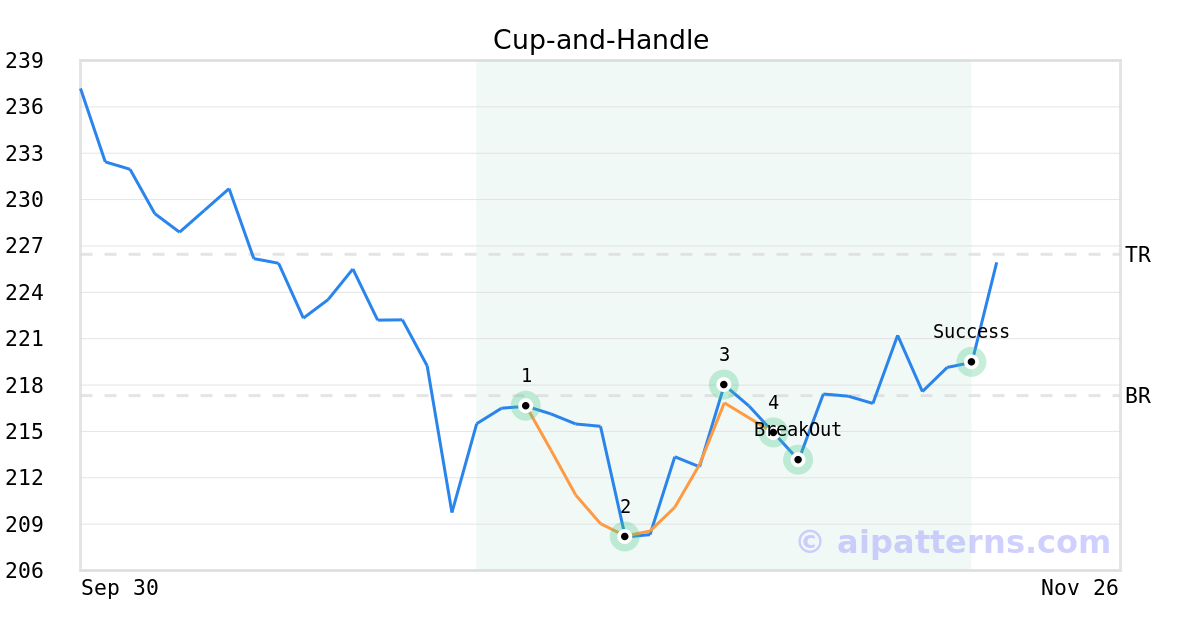
On November 07, 2025, A.I.dvisor detected a Cup-and-Handle Pattern (Bullish) for Grupo Aeroportuario del Pacifico SAB de CV Amer Dep Shares (each rep 10 Ser B shares) (PAC, $214.90). On November 10, 2025, A.I.dvisor confirmed the Bullish pattern, setting a target price of $226.46. 9 days later, on November 19, 2025, PAC reached the target price resulting in a for traders who took a long position in the stock.
Momentum Indicator for PAC turns positive, indicating new upward trend
PAC saw its Momentum Indicator move above the 0 level on November 11, 2025. This is an indication that the stock could be shifting in to a new upward move. Traders may want to consider buying the stock or buying call options. Tickeron's A.I.dvisor looked at 92 similar instances where the indicator turned positive. In of the 92 cases, the stock moved higher in the following days. The odds of a move higher are at .

Technical Analysis (Indicators)
Bullish Trend Analysis
The RSI Oscillator points to a transition from a downward trend to an upward trend -- in cases where PAC's RSI Indicator exited the oversold zone, of 18 resulted in an increase in price. Tickeron's analysis proposes that the odds of a continued upward trend are .
The Moving Average Convergence Divergence (MACD) for PAC just turned positive on November 04, 2025. Looking at past instances where PAC's MACD turned positive, the stock continued to rise in of 54 cases over the following month. The odds of a continued upward trend are .
Following a 3-day Advance, the price is estimated to grow further. Considering data from situations where PAC advanced for three days, in of 341 cases, the price rose further within the following month. The odds of a continued upward trend are .
PAC may jump back above the lower band and head toward the middle band. Traders may consider buying the stock or exploring call options.
Bearish Trend Analysis
The Stochastic Oscillator may be shifting from an upward trend to a downward trend. In of 58 cases where PAC's Stochastic Oscillator exited the overbought zone, the price fell further within the following month. The odds of a continued downward trend are .
Following a 3-day decline, the stock is projected to fall further. Considering past instances where PAC declined for three days, the price rose further in of 62 cases within the following month. The odds of a continued downward trend are .
The Aroon Indicator for PAC entered a downward trend on November 11, 2025. This could indicate a strong downward move is ahead for the stock. Traders may want to consider selling the stock or buying put options.
Fundamental Analysis (Ratings)
The Tickeron SMR rating for this company is (best 1 - 100 worst), indicating very strong sales and a profitable business model. SMR (Sales, Margin, Return on Equity) rating is based on comparative analysis of weighted Sales, Income Margin and Return on Equity values compared against S&P 500 index constituents. The weighted SMR value is a proprietary formula developed by Tickeron and represents an overall profitability measure for a stock.
The Tickeron Profit vs. Risk Rating rating for this company is (best 1 - 100 worst), indicating low risk on high returns. The average Profit vs. Risk Rating rating for the industry is 66, placing this stock better than average.
The Tickeron PE Growth Rating for this company is (best 1 - 100 worst), pointing to average earnings growth. The PE Growth rating is based on a comparative analysis of stock PE ratio increase over the last 12 months compared against S&P 500 index constituents.
The Tickeron Price Growth Rating for this company is (best 1 - 100 worst), indicating fairly steady price growth. PAC’s price grows at a lower rate over the last 12 months as compared to S&P 500 index constituents.
The Tickeron Valuation Rating of (best 1 - 100 worst) indicates that the company is slightly overvalued in the industry. This rating compares market capitalization estimated by our proprietary formula with the current market capitalization. This rating is based on the following metrics, as compared to industry averages: P/B Ratio (9.671) is normal, around the industry mean (41.241). P/E Ratio (20.215) is within average values for comparable stocks, (32.043). Projected Growth (PEG Ratio) (1.031) is also within normal values, averaging (1.106). Dividend Yield (0.040) settles around the average of (0.031) among similar stocks. P/S Ratio (4.946) is also within normal values, averaging (17.910).
Advertisement
General Information
an operator of airports in Mexico
Industry AirFreightCouriers