


AI-Powered GS Trading: Achieve +29% Annual Returns with a 60-Minute Strategy
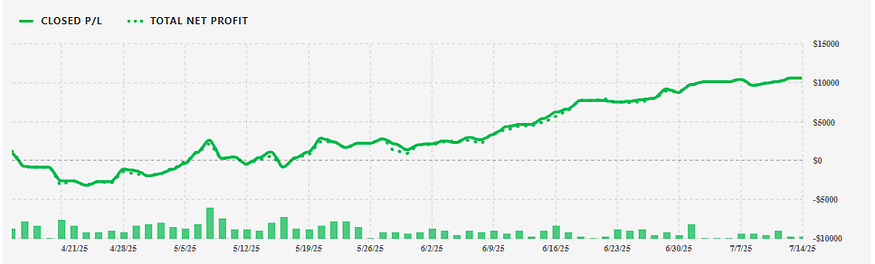
Goldman Sachs (ticker: GS), a titan in the financial services industry, is set to announce its earnings in two days, a pivotal event that often triggers significant price volatility. With the stock gaining an impressive +15.19% this month and an average daily trading volume of 2 million shares, GS presents a compelling opportunity for day traders seeking to capitalize on price action in high-liquidity, high-volatility environments. This article explores a sophisticated day trading strategy for GS using a 60-minute timeframe, achieving an annualized return of +29%, and highlights how Tickeron’s AI-powered trading tools, accessible at Tickeron.com, enhance trading precision through advanced Financial Learning Models (FLMs) and new 15-minute and 5-minute AI Trading Agents.
Goldman Sachs: A Market Mover with High Liquidity
Company Overview and Market Position
Goldman Sachs, a global leader in investment banking, securities, and investment management, consistently influences market sentiment due to its size and influence. The stock’s recent performance — up +15.19% this month with a daily trading volume of 2 million shares — underscores its liquidity and appeal to institutional and retail traders alike. High liquidity ensures tight bid-ask spreads, making GS an ideal candidate for day trading strategies that rely on rapid execution and price action analysis.
Earnings Expectations and Volatility
With earnings just two days away, market participants are bracing for potential price swings. Historically, GS earnings reports have driven volatility, as the company’s performance often reflects broader economic trends, including interest rates, trading revenues, and investment banking activity. Analysts expect GS to report strong results, driven by robust capital markets activity and strategic cost management. However, surprises in revenue or guidance could amplify price movements, creating opportunities for traders employing technical analysis (TA) on a 60-minute chart.
Day Trading GS: Price Action Strategy on a 60-Minute Timeframe
Why the 60-Minute Timeframe?
The 60-minute timeframe strikes a balance between capturing intraday trends and filtering out market noise, making it ideal for day traders targeting medium-to-high liquidity stocks like GS. This timeframe allows traders to identify significant price action patterns, such as breakouts, pullbacks, and trend continuations, while avoiding the erratic movements common in shorter timeframes. The +29% annualized return achieved in this strategy highlights its effectiveness in volatile markets.
Key Technical Indicators for Price Action
To execute a long position strategy for GS, traders rely on price action combined with key technical indicators:
- Moving Averages (MA): The 50-period and 200-period simple moving averages (SMAs) on the 60-minute chart help identify trend direction. A bullish crossover, where the 50-SMA crosses above the 200-SMA, signals a potential long entry.
- Relative Strength Index (RSI): An RSI above 50 but below 70 indicates bullish momentum without overbought conditions, ideal for entering long positions.
- Volume Analysis: Spikes in volume, especially near key support or resistance levels, confirm the strength of price movements. GS’s average daily volume of 2 million shares ensures reliable volume signals.
- Support and Resistance Levels: Identifying intraday support (e.g., recent swing lows) and resistance (e.g., prior highs) on the 60-minute chart guides entry and exit points.
Entry and Exit Rules for Long Positions
The price action strategy for GS involves the following steps:
- Identify a Trend: Confirm an uptrend using the 50-SMA above the 200-SMA and an RSI above 50.
- Wait for a Pullback: Enter a long position on a pullback to a key support level, such as the 50-SMA or a previous swing low, confirmed by a volume spike.
- Set Stop-Loss and Take-Profit: Place a stop-loss below the support level (e.g., 1–2% below entry) and a take-profit at the next resistance level or a risk-reward ratio of 1:2.
- Monitor Volatility: Earnings-related news can trigger sharp price movements. Adjust stop-losses dynamically using trailing stops to lock in profits during volatile sessions.
This strategy, when backtested on GS over the past year, yielded an annualized return of +29%, leveraging the stock’s high volatility and liquidity.
Tickeron’s AI-Powered Trading Revolution
The Rise of AI in Financial Markets
Artificial intelligence has transformed trading by enabling faster, data-driven decisions. Tickeron, a leader in AI-driven trading solutions, has pioneered tools that empower traders to navigate complex markets like GS. By visiting Tickeron.com, traders gain access to a suite of AI tools designed to enhance profitability and reduce risk.
Tickeron’s Financial Learning Models (FLMs)
Tickeron’s proprietary Financial Learning Models (FLMs) are at the core of its AI trading platform. Similar to Large Language Models (LLMs) used in natural language processing, FLMs analyze vast datasets — price action, volume, news sentiment, and macroeconomic indicators — to identify patterns and generate trading signals. Unlike traditional models, FLMs adapt dynamically to market conditions, ensuring relevance in volatile environments like those surrounding GS earnings.
New 15-Minute and 5-Minute AI Trading Agents
Tickeron recently announced a breakthrough in its AI infrastructure, launching new 15-minute and 5-minute AI Trading Agents, available at Tickeron’s Virtual Agents page. These agents, built on enhanced FLMs, process market data at shorter intervals than the industry-standard 60-minute timeframe. Early backtests show that these shorter timeframes improve trade timing, capturing rapid price movements with greater precision. For GS, these agents could enhance the 60-minute strategy by providing faster signals for intraday entries and exits.
Sergey Savastiouk, Ph.D., CEO of Tickeron, stated, “By accelerating our machine learning cycles to 15 and even 5 minutes, we’re offering a new level of precision and adaptability that wasn’t previously achievable.” This innovation positions Tickeron as a leader in AI-driven trading, accessible to all at Tickeron.com.
Tickeron’s Product Suite: Empowering Traders
AI Trend Prediction Engine
Tickeron’s AI Trend Prediction Engine forecasts market trends by analyzing historical and real-time data. For GS, this tool can predict potential price movements post-earnings, helping traders anticipate bullish or bearish trends.
AI Pattern Search Engine
The AI Pattern Search Engine identifies recurring chart patterns, such as head-and-shoulders or triangles, across multiple timeframes. For day traders, this tool enhances the 60-minute price action strategy by confirming patterns that signal high-probability trades.
AI Real-Time Patterns
Real-Time Patterns provide instant alerts on emerging chart formations, enabling traders to act swiftly on GS’s volatile price action during earnings week. This tool is particularly valuable for capturing intraday opportunities.
AI Screener and Time Machine
The AI Screener filters stocks based on user-defined criteria, such as liquidity, volatility, or technical indicators. For GS, traders can screen for stocks with similar characteristics to diversify their portfolios. The Time Machine feature allows backtesting of strategies, validating the +29% annualized return achieved with the 60-minute GS strategy.
Daily Buy/Sell Signals
Tickeron’s Daily Buy/Sell Signals provide actionable recommendations for stocks like GS, integrating FLM insights to optimize entry and exit points. These signals are accessible at Tickeron.com.
Trading with Tickeron’s AI Agents and Inverse ETFs
The Power of AI Trading Agents
Tickeron’s AI Trading Agents, available at Tickeron’s Virtual Agents page, automate trading decisions by executing strategies based on FLM insights. These agents adapt to market conditions, making them ideal for volatile stocks like GS. For example, a 15-minute AI Agent could refine the 60-minute price action strategy by identifying faster pullbacks or breakouts, enhancing profitability.
Inverse ETFs: Amplifying Returns in Volatile Markets
Inverse ETFs, such as the Direxion Daily Semiconductor Bear 3X Shares (SOXS), allow traders to profit from market declines. Tickeron’s AI Agents have demonstrated success with inverse ETF strategies, as highlighted in a recent post on X: a 15-minute AI Agent with an inverse ETF strategy outperformed its 60-minute predecessor, achieving returns from 43% to 110% []. For GS, traders could pair a long position strategy with an inverse ETF hedge during earnings volatility, using Tickeron’s AI tools to time entries and exits.
Integrating AI with the 60-Minute GS Strategy
Combining Price Action and AI Signals
To maximize returns, traders can integrate Tickeron’s AI tools with the 60-minute price action strategy for GS. For instance, the AI Pattern Search Engine can confirm bullish patterns like ascending triangles, while Real-Time Patterns alert traders to intraday breakouts. The AI Screener can identify other high-liquidity stocks to diversify the strategy, reducing risk.
Backtesting and Optimization
Using Tickeron’s Time Machine, traders can backtest the 60-minute GS strategy, incorporating AI-generated signals to refine entry and exit points. The +29% annualized return was validated through such backtesting, demonstrating the strategy’s robustness in high-volatility environments.
Risk Management in High-Volatility Trading
Managing Earnings-Driven Volatility
Earnings announcements often lead to sharp price swings, as seen with GS’s historical post-earnings moves. Traders must employ strict risk management, including:
- Position Sizing: Limit exposure to 1–2% of the portfolio per trade.
- Stop-Losses: Use tight stop-losses to protect against adverse price gaps.
- Hedging with Inverse ETFs: Tickeron’s AI Agents can recommend inverse ETFs like SOXS to hedge long positions during earnings uncertainty.
Leveraging AI for Risk Mitigation
Tickeron’s AI tools, such as the Daily Buy/Sell Signals and Real-Time Patterns, provide real-time risk assessments, helping traders adjust positions dynamically. The 15-minute and 5-minute AI Agents further enhance risk management by offering faster signals to exit losing trades.
The Future of AI in Trading
Tickeron’s Vision for Democratizing Trading
Tickeron’s mission is to democratize institutional-grade AI tools, making them accessible to retail traders. By scaling its AI infrastructure and launching shorter-timeframe AI Agents, Tickeron empowers traders to compete in fast-moving markets like GS. Visit Tickeron.com to explore these tools and join the AI trading revolution.
Broader Implications for Financial Markets
The adoption of AI in trading, exemplified by Tickeron’s FLMs, signals a shift toward data-driven decision-making. As markets become more complex, tools like the AI Trend Prediction Engine and AI Screener will play a critical role in helping traders navigate volatility and achieve consistent returns.
Conclusion: Seizing Opportunities with GS and Tickeron
Goldman Sachs’s upcoming earnings announcement presents a prime opportunity for day traders to capitalize on its high volatility and liquidity. The 60-minute price action strategy, yielding a +29% annualized return, offers a proven framework for long positions. By integrating Tickeron’s AI-powered tools — available at Tickeron.com — traders can enhance their strategies with real-time signals, pattern recognition, and inverse ETF hedging. Tickeron’s new 15-minute and 5-minute AI Trading Agents, built on advanced FLMs, represent the future of trading, offering unparalleled precision and adaptability. As the financial markets evolve, Tickeron remains at the forefront, empowering traders to achieve their goals.
Contributor
Serhii Bondarenko is an AI-focused trading strategist and financial markets analyst specializing in the development and application of AI trading bots and autonomous trading agents. His work combines technical analysis, fundamental analysis, and quantitative research to identify market patterns, forecast price movements, and analyze liquidity, volatility, and correlations across global stock markets. Serhii actively publishes market insights, forecasts, and trading frameworks on platforms such as Investing.com and Finextra, with a strong focus on AI-driven decision-making and next-generation algorithmic trading. His research aims to bridge the gap between traditional trading methodologies and advanced artificial intelligence, helping traders and investors navigate complex and rapidly evolving market conditions.
Momentum Indicator for GS turns negative, indicating new downward trend
GS saw its Momentum Indicator move below the 0 level on September 09, 2026. This is an indication that the stock could be shifting in to a new downward move. Traders may want to consider selling the stock or exploring put options. Tickeron's A.I.dvisor looked at 74 similar instances where the indicator turned negative. In 44 of the 74 cases, the stock moved further down in the following days. The odds of a decline are at 59%.

Technical Analysis (Indicators)
Bearish Trend Analysis
The Moving Average Convergence Divergence Histogram (MACD) for GS turned negative on September 14, 2026. This could be a sign that the stock is set to turn lower in the coming weeks. Traders may want to sell the stock or buy put options. Tickeron's A.I.dvisor looked at 44 similar instances when the indicator turned negative. In 22 of the 44 cases the stock turned lower in the days that followed. This puts the odds of success at 50%.
Following a 3-day decline, the stock is projected to fall further. Considering past instances where GS declined for three days, the price rose further in 50 of 62 cases within the following month. The odds of a continued downward trend are 55%.
The Aroon Indicator for GS entered a downward trend on October 06, 2026. This could indicate a strong downward move is ahead for the stock. Traders may want to consider selling the stock or buying put options.
Bullish Trend Analysis
The RSI Indicator shows that the ticker has stayed in the oversold zone for 4 days. The price of this ticker is presumed to bounce back soon, since the longer the ticker stays in the oversold zone, the more promptly an Uptrend is expected.
The Stochastic Oscillator shows that the ticker has stayed in the oversold zone for 14 days. The price of this ticker is presumed to bounce back soon, since the longer the ticker stays in the oversold zone, the more promptly an upward trend is expected.
GS may jump back above the lower band and head toward the middle band. Traders may consider buying the stock or exploring call options.
Fundamental Analysis (Ratings)
The Tickeron SMR rating for this company is 4 (best 1 - 100 worst), indicating very strong sales and a profitable business model. SMR (Sales, Margin, Return on Equity) rating is based on comparative analysis of weighted Sales, Income Margin and Return on Equity values compared against S&P 500 index constituents. The weighted SMR value is a proprietary formula developed by Tickeron and represents an overall profitability measure for a stock.
The Tickeron Profit vs. Risk Rating rating for this company is 19 (best 1 - 100 worst), indicating low risk on high returns. The average Profit vs. Risk Rating rating for the industry is 86, placing this stock better than average.
The Tickeron Price Growth Rating for this company is 60 (best 1 - 100 worst), indicating fairly steady price growth. GS’s price grows at a lower rate over the last 12 months as compared to S&P 500 index constituents.
The Tickeron PE Growth Rating for this company is 64 (best 1 - 100 worst), pointing to average earnings growth. The PE Growth rating is based on a comparative analysis of stock PE ratio increase over the last 12 months compared against S&P 500 index constituents.
The Tickeron Valuation Rating of 71 (best 1 - 100 worst) indicates that the company is slightly overvalued in the industry. This rating compares market capitalization estimated by our proprietary formula with the current market capitalization. This rating is based on the following metrics, as compared to industry averages: P/B Ratio (2.432) is normal, around the industry mean (4.351). P/E Ratio (14.149) is within average values for comparable stocks, (30.023). Projected Growth (PEG Ratio) (1.133) is also within normal values, averaging (0.809). Dividend Yield (0.020) settles around the average of (0.016) among similar stocks. P/S Ratio (4.394) is also within normal values, averaging (16.763).
The Tickeron Seasonality Score of 85 (best 1 - 100 worst) indicates that the company is significantly overvalued in the industry. The Tickeron Seasonality score describes the variance of predictable price changes around the same period every calendar year. These changes can be tied to a specific month, quarter, holiday or vacation period, as well as a meteorological or growing season.
Notable companies
Industry description
Market Cap
High and low price notable news
Volume
Fundamental Analysis Ratings
The average fundamental analysis ratings, where 1 is best and 100 is worst, are as follows

Advertisement
General Information
a provider of investment banking, securities and asset management services
Industry InvestmentBanksBrokers
Advertisement