Real Time Patterns (RTP)
- Set up pattern search criteria
- Receive patterns in your feed
Real-time pattern trading is a smart way to find entry and exit prices if you can scan thousands of stocks and ETFs within minutes. It is definitely impossible for humans. Artificial Intelligence (A.I.) not only discovers these patterns, but also checks if they worked out well in the past. Knowing the success rate in the past allows A.I. to establish the odds of success in the future.


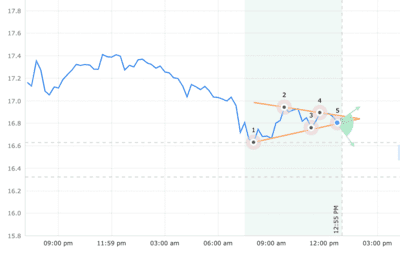
Triangle Symmetrical Bottom


The Symmetrical Triangle Bottom pattern forms when the price of a security fails to retest a high or a low and ultimately forms two narrowing trend lines. Points 1 5 form the triangle patterns. The price is expected to move up or down past the triangle depending on which line is broken first.
This pattern is commonly associated with directionless markets since the contraction (narrowing) of the market range signals that neither bulls nor bears are in control. However, there is a distinct possibility that market participants will either pour in or sell out, and the price can move up or down with big volumes (leading up to the breakout).
Trade Idea
If price breaks out from the bottom pattern boundary, day traders and swing traders should trade with the DOWN trend. Consider selling the security short or buying a put option at the downward breakout price level. To identify an exit, calculate the pattern height by taking the difference between the highest high and the lowest low. Then, calculate the target price by subtracting the pattern height from the breakout price, which is the lowest low.
To limit potential loss when price suddenly goes in the wrong direction, consider placing a stop order to buy back a short position or sell a put option at or above the breakout price.
Time frames No matter your trading strategy (day trading, swing, etc), we have patterns that will be ready to trade.
Triangle Symmetrical Bottom (Bearish)
15.516000 USD CURRENT PRICE
AR.X - Arweave cryptocurrency
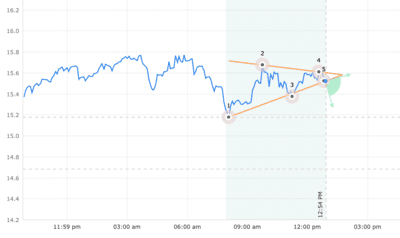
| STATUS | Emerged |
|---|---|
| CURRENT CONFIDENCE | 17% |
| TARGET (EXIT) PRICE | 15.180000 USD |
| BREAKOUT (ENTRY) PRICE | 14.684000 USD |
| DISTANCE TO TARGET PRICE | 5.36% |
| EMERGED ON | Aug 15, 12:50 PM (UTC) |
| WITH CONFIDENCE LEVEL | 17% |
Statistics for ‘Triangle Symmetrical Bottom‘
Triangle Symmetrical Bottom (Bearish)
10.399000 USD CURRENT PRICE
DEGO.X - Dego Finance cryptocurrency
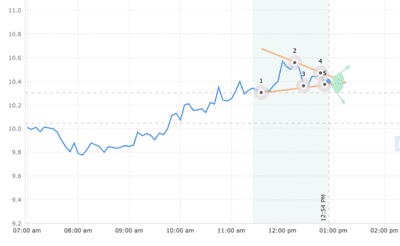
| STATUS | Emerged |
|---|---|
| CURRENT CONFIDENCE | 45% |
| TARGET (EXIT) PRICE | 10.301000 USD |
| BREAKOUT (ENTRY) PRICE | 10.045000 USD |
| DISTANCE TO TARGET PRICE | 3.40% |
| EMERGED ON | Aug 15, 12:50 PM (UTC) |
| WITH CONFIDENCE LEVEL | 56% |
Statistics for ‘Triangle Symmetrical Bottom‘
Triangle Symmetrical Bottom (Bearish)
1.757000 USD CURRENT PRICE
PUNDIX.X - Pundi X[new] cryptocurrency
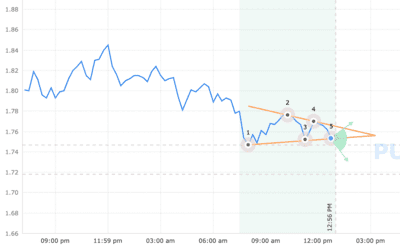
| STATUS | Emerged |
|---|---|
| CURRENT CONFIDENCE | 40% |
| TARGET (EXIT) PRICE | 1.747000 USD |
| BREAKOUT (ENTRY) PRICE | 1.718000 USD |
| DISTANCE TO TARGET PRICE | 2.22% |
| EMERGED ON | Aug 15, 12:45 PM (UTC) |
| WITH CONFIDENCE LEVEL | 41% |
Statistics for ‘Triangle Symmetrical Bottom‘
Triangle Symmetrical Bottom (Bearish)
12.220000 USD CURRENT PRICE
SNX.X1 - Synthetix cryptocurrency
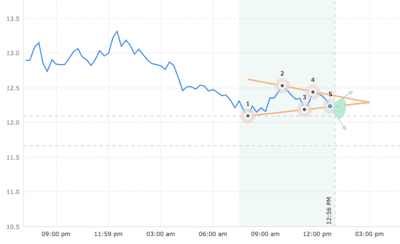
| STATUS | Emerged |
|---|---|
| CURRENT CONFIDENCE | 37% |
| TARGET (EXIT) PRICE | 12.096000 USD |
| BREAKOUT (ENTRY) PRICE | 11.666000 USD |
| DISTANCE TO TARGET PRICE | 4.53% |
| EMERGED ON | Aug 15, 12:45 PM (UTC) |
| WITH CONFIDENCE LEVEL | 37% |
Statistics for ‘Triangle Symmetrical Bottom‘
Triangle Symmetrical Bottom (Bearish)
16.841000 USD CURRENT PRICE
LUNA.X3 - Terra cryptocurrency
| STATUS | Emerged |
|---|---|
| CURRENT CONFIDENCE | 39% |
| TARGET (EXIT) PRICE | 16.631000 USD |
| BREAKOUT (ENTRY) PRICE | 16.321000 USD |
| DISTANCE TO TARGET PRICE | 3.09% |
| EMERGED ON | Aug 15, 12:45 PM (UTC) |
| WITH CONFIDENCE LEVEL | 40% |