Screener of PennyStock Bullish Triangle Symmetrical Bottom
AI Pattern Search Engine (PSE)
Operating the Pattern Search Engine is easy and straightforward
- Set up pattern search criteria
- Receive patterns in your feed
- Bookmark patterns to track their status
How It Works
Trading patterns is one of the most sophisticated trading strategies. It exploits the psychology of market participants, and takes advantage of the knowledge of market insights.If you want to use AI to discover these hidden effects, then Tickeron’s Pattern Search Engine is the tool you need. Using PSE, AI will teach you to recognize patterns and entry and exit points.
Pattern Types and Stats


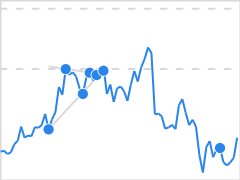
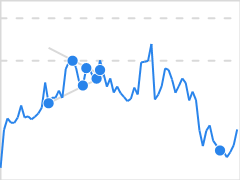
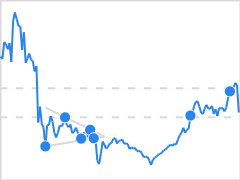
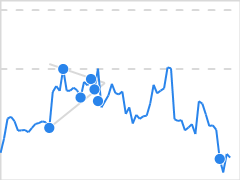
Triangle Symmetrical Bottom


The Symmetrical Triangle Bottom pattern forms when the price of a security fails to retest a high or a low and ultimately forms two narrowing trend lines. As the support and resistance levels consolidate, it forms a triangle (15). Symmetrical Triangles are characterized by the upper line sloping downward and lower line sloping upward. The price movement inside the triangle should fill the shape with some uniformity, without leaving large blank areas.
This pattern is commonly associated with directionless markets, since the contraction (narrowing) of the market range signals that neither bulls nor bears are in control. However, there is a distinct possibility that market participants will either pour in or sell out, and the price can move up or down with big volumes (leading up to the breakout).
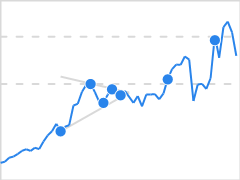
Trade Idea
If the price breaks out from the top pattern boundary, day traders and swing traders should trade with an UP trend. Consider buying a security or a call option at the breakout price level. To identify an exit, compute the target price by adding the pattern height from the breakout point. The height of the pattern is the difference between the highest high and lowest low.
To limit potential loss when price suddenly goes in the wrong direction, consider placing a stop order to sell at or below the breakout price.