Real Time Patterns (RTP)
- Set up pattern search criteria
- Receive patterns in your feed
Real-time pattern trading is a smart way to find entry and exit prices if you can scan thousands of stocks and ETFs within minutes. It is definitely impossible for humans. Artificial Intelligence (A.I.) not only discovers these patterns, but also checks if they worked out well in the past. Knowing the success rate in the past allows A.I. to establish the odds of success in the future.


Channel down


A Channel Down pattern shows a clearly defined downtrend and describes the behavior of the price contained between downward sloping parallel lines. Lower lows and lower highs characterize this price pattern. This pattern is created via a lower trendline connecting the swing lows (1, 3, 5), and an upper channel line that joins the swing highs (2, 4, 6).
A breakdown below a descending channel’s resistance line points to a continuation of the decline momentum, while a break out above the channel’s resistance line can show a possible trend change.
When a security is presumed likely to remain within the channel, traders can make bets on price fluctuations within the channel trendline boundaries. This type of trading strategy can be particularly successful when a trader has identified a reversal followed by a breakout series pattern.
Selling bets can be made when the price reaches its resistance line. Going long on the security could also be profitable when a security begins to reach its support trendline.
The difference between a Channel Up and a Channel Down is the trend they describe: the former characterizes an Uptrend while the latter describes a Downtrend.
Time frames No matter your trading strategy (day trading, swing, etc), we have patterns that will be ready to trade.
Channel down (Bearish)
128.74 USD CURRENT PRICE
PEGA - Pegasystems Inc.
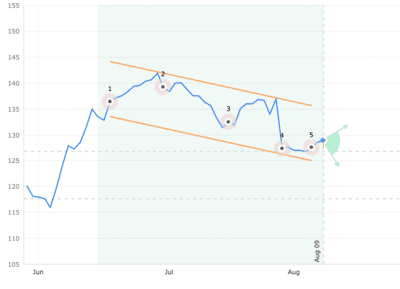
| STATUS | Emerged |
|---|---|
| CURRENT CONFIDENCE | 35% |
| TARGET (EXIT) PRICE | 126.75 USD |
| BREAKOUT (ENTRY) PRICE | 117.67 USD |
| DISTANCE TO TARGET PRICE | 8.60% |
| EMERGED ON | Aug 05, closing price |
| WITH CONFIDENCE LEVEL | 35% |
Statistics for ‘Channel down‘
Channel down (Bearish)
34.04 USD CURRENT PRICE
GNTY - Guaranty Bancshares, Inc. (TX)
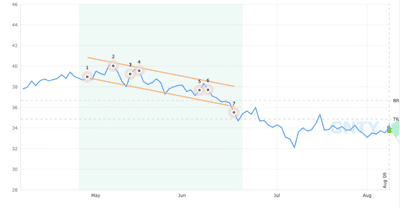
| STATUS | Emerged |
|---|---|
| CURRENT CONFIDENCE | 39% |
| TARGET (EXIT) PRICE | 36.65 USD |
| BREAKOUT (ENTRY) PRICE | 34.84 USD |
| DISTANCE TO TARGET PRICE | Target reached |
| EMERGED ON | Jun 17, closing price |
| WITH CONFIDENCE LEVEL | 39% |
Statistics for ‘Channel down‘
Channel down (Bearish)
42.52 USD CURRENT PRICE
NATI - National Instruments Corp.
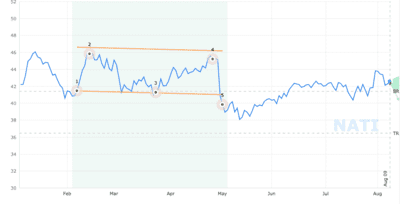
| STATUS | Emerged |
|---|---|
| CURRENT CONFIDENCE | 29% |
| TARGET (EXIT) PRICE | 41.41 USD |
| BREAKOUT (ENTRY) PRICE | 36.47 USD |
| DISTANCE TO TARGET PRICE | 14.24% |
| EMERGED ON | May 03, closing price |
| WITH CONFIDENCE LEVEL | 29% |
Statistics for ‘Channel down‘
Channel down (Bearish)
19.16 USD CURRENT PRICE
IBN - ICICI Bank Ltd. - ADR
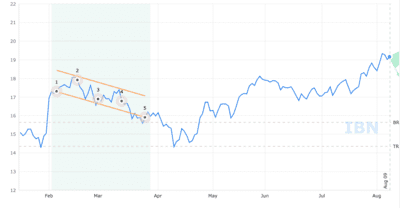
| STATUS | Emerged |
|---|---|
| CURRENT CONFIDENCE | 29% |
| TARGET (EXIT) PRICE | 15.63 USD |
| BREAKOUT (ENTRY) PRICE | 14.35 USD |
| DISTANCE TO TARGET PRICE | 25.12% |
| EMERGED ON | Mar 25, closing price |
| WITH CONFIDENCE LEVEL | 29% |
Statistics for ‘Channel down‘
Channel down (Bearish)
27.02 USD CURRENT PRICE
ILPT - Industrial Logistics Properties Trust

| STATUS | Emerged |
|---|---|
| CURRENT CONFIDENCE | 39% |
| TARGET (EXIT) PRICE | 21.21 USD |
| BREAKOUT (ENTRY) PRICE | 19.75 USD |
| DISTANCE TO TARGET PRICE | 26.92% |
| EMERGED ON | Feb 09, closing price |
| WITH CONFIDENCE LEVEL | 0% |