Real Time Patterns (RTP)
- Set up pattern search criteria
- Receive patterns in your feed
Real-time pattern trading is a smart way to find entry and exit prices if you can scan thousands of stocks and ETFs within minutes. It is definitely impossible for humans. Artificial Intelligence (A.I.) not only discovers these patterns, but also checks if they worked out well in the past. Knowing the success rate in the past allows A.I. to establish the odds of success in the future.


Broadening Wedge Descending


The Broadening Wedge Descending pattern forms when a security price makes lower lows (1, 3, 5) and lower highs (2, 4), forming two downward sloping lines that expand over time (kind of like a pointed down megaphone shape). This pattern may form when large investors spread out their selling over a period of time, and the Breakout can occur in either direction.
When the initial selling occurs, other market participants react to falling price and jump on the bandwagon to participate. Then the value investors begin to sell, believing the price has not fallen enough, which spurs the original large investor to resume selling again.
Trade Idea
If price breaks out from the bottom pattern boundary, day traders and swing traders should trade with a DOWN trend. Consider selling the security short or buying a put option at the downward breakout price level. To identify an exit, compute the target price by assessing the difference between the pattern’s lowest high (2) and the breakout level. That is the pattern height. The target price can be calculated by subtracting the pattern height from the downward breakout level, which is the last low touching the bottom line.
To limit potential loss when price suddenly goes in the wrong direction, consider placing a stop order to buy back a short position or sell a put option at or above the breakout price.
Time frames No matter your trading strategy (day trading, swing, etc), we have patterns that will be ready to trade.
Broadening Wedge Descending (Bearish)
7.24 USD CURRENT PRICE
CRIS - Curis Inc
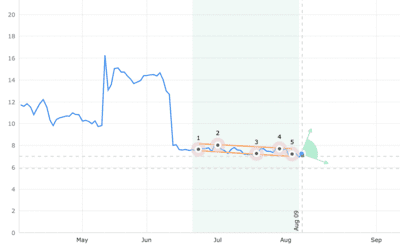
| STATUS | Emerged |
|---|---|
| CURRENT CONFIDENCE | 77% |
| TARGET (EXIT) PRICE | 6.99 USD |
| BREAKOUT (ENTRY) PRICE | 5.91 USD |
| DISTANCE TO TARGET PRICE | 18.26% |
| EMERGED ON | Aug 04, closing price |
| WITH CONFIDENCE LEVEL | 77% |
Statistics for ‘Broadening Wedge Descending‘
Broadening Wedge Descending (Bearish)
92.36 USD CURRENT PRICE
NTES - NetEase Inc - ADR

| STATUS | Emerged |
|---|---|
| CURRENT CONFIDENCE | 100% |
| TARGET (EXIT) PRICE | 103.53 USD |
| BREAKOUT (ENTRY) PRICE | 91.81 USD |
| DISTANCE TO TARGET PRICE | 0.60% |
| EMERGED ON | Jul 26, closing price |
| WITH CONFIDENCE LEVEL | 100% |
Statistics for ‘Broadening Wedge Descending‘
Broadening Wedge Descending (Bearish)
52.91 USD CURRENT PRICE
NWN - Northwest Natural Holding Co
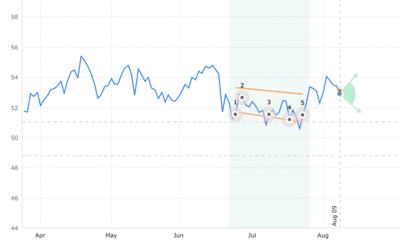
| STATUS | Emerged |
|---|---|
| CURRENT CONFIDENCE | 53% |
| TARGET (EXIT) PRICE | 51.04 USD |
| BREAKOUT (ENTRY) PRICE | 48.81 USD |
| DISTANCE TO TARGET PRICE | 7.76% |
| EMERGED ON | Jul 23, closing price |
| WITH CONFIDENCE LEVEL | 53% |
Statistics for ‘Broadening Wedge Descending‘
Broadening Wedge Descending (Bearish)
52.91 USD CURRENT PRICE
NWN - Northwest Natural Holding Co
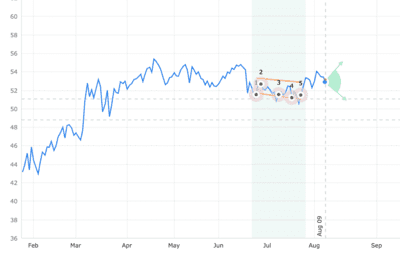
| STATUS | Emerged |
|---|---|
| CURRENT CONFIDENCE | 54% |
| TARGET (EXIT) PRICE | 51.04 USD |
| BREAKOUT (ENTRY) PRICE | 48.81 USD |
| DISTANCE TO TARGET PRICE | 7.76% |
| EMERGED ON | Jul 23, closing price |
| WITH CONFIDENCE LEVEL | 54% |
Statistics for ‘Broadening Wedge Descending‘
Broadening Wedge Descending (Bearish)
4.11 USD CURRENT PRICE
CANG - Cango Inc - ADR
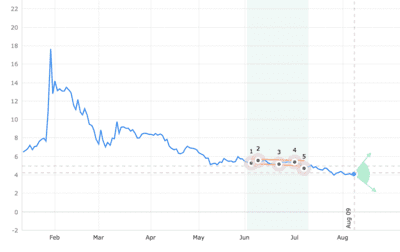
| STATUS | Emerged |
|---|---|
| CURRENT CONFIDENCE | 57% |
| TARGET (EXIT) PRICE | 4.96 USD |
| BREAKOUT (ENTRY) PRICE | 4.22 USD |
| DISTANCE TO TARGET PRICE | Target reached |
| EMERGED ON | Jul 08, closing price |
| WITH CONFIDENCE LEVEL | 57% |